
















Copyright: ©Author(s) 2026.
World J Gastroenterol. Jul 28, 2026; 32(28): 118458
Published online Jul 28, 2026. doi: 10.3748/wjg.118458
Published online Jul 28, 2026. doi: 10.3748/wjg.118458
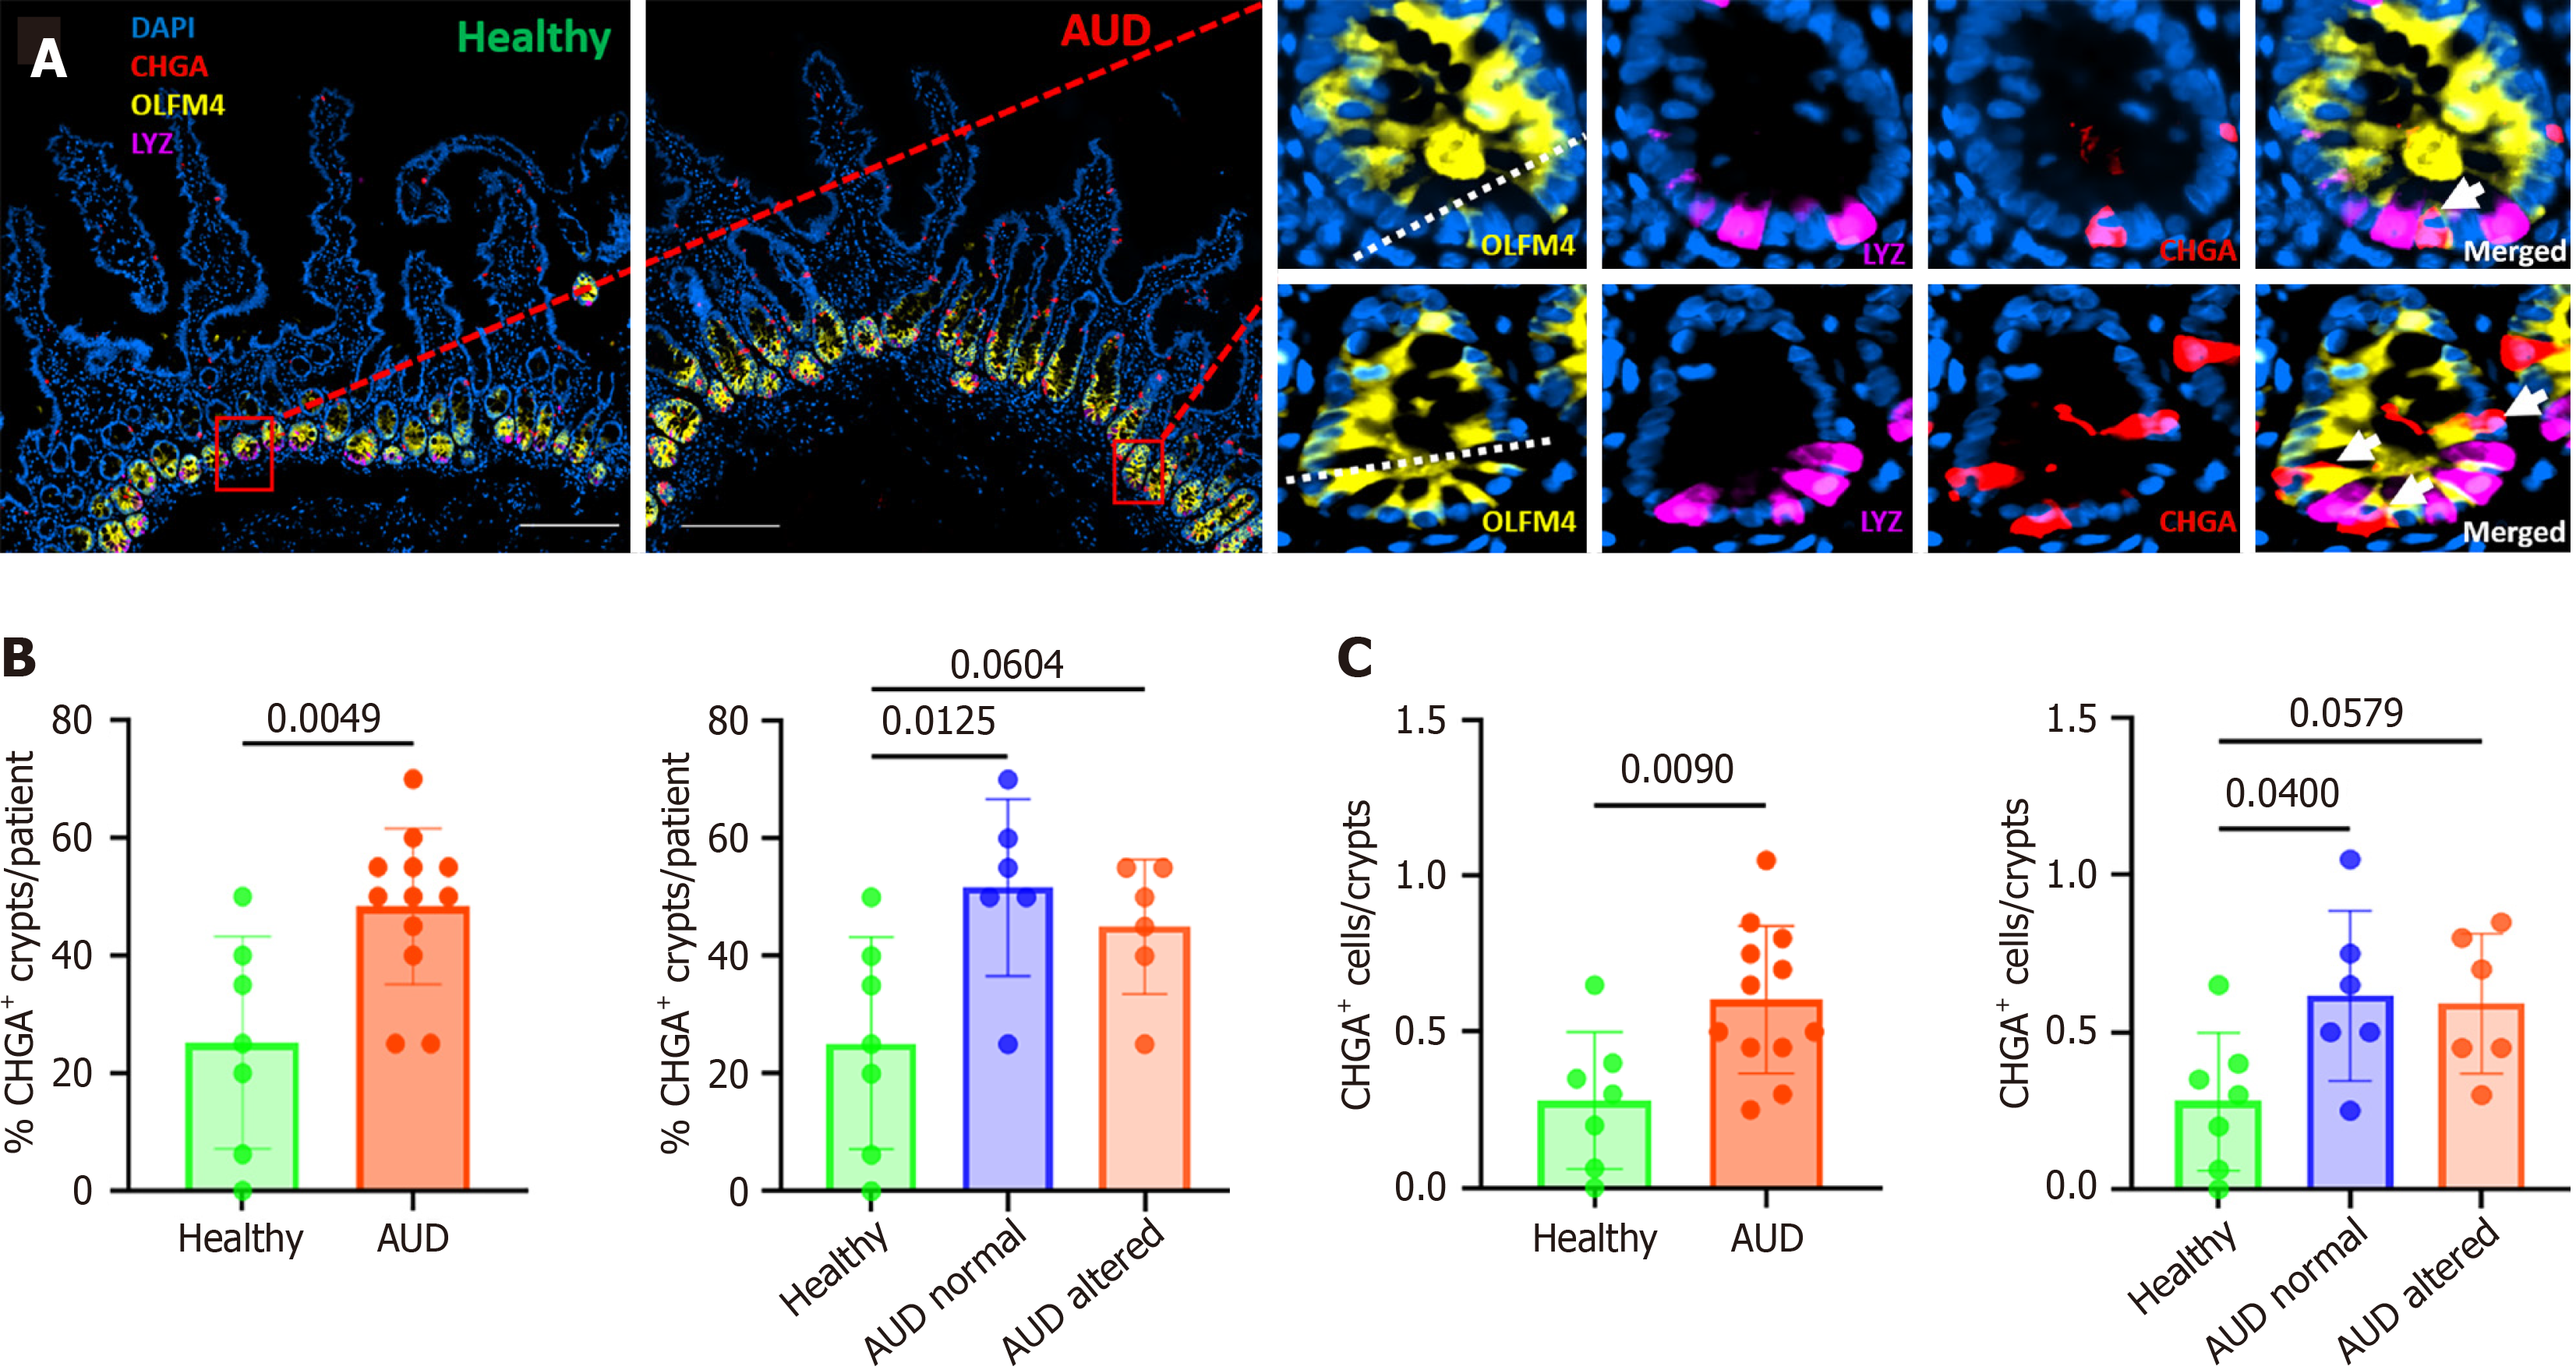
Figure 3 Cell composition of the crypts.
A: Multiplex immunofluorescence of duodenal biopsy from healthy and alcohol use disorder (AUD) patients. OLFM4 (yellow) marks stem and stem-like cells, CHGA (red) labels enteroendocrine cells, lysozyme (purple) identifies Paneth cells, DAPI (blue) marks nuclei; B: Quantification of the number of crypts containing at least one CHGA+ cell. The percentage of CHGA+ crypts was increased in both AUD subgroups compared with healthy controls. For each patient, 5-10 crypts were analyzed; C: Quantification of CHGA+ in each crypt. The number of CHGA+ cells per crypt was significantly higher in both AUD normal and AUD altered patients. Data are presented as mean ± SD. Each dot on the bar graphs represents one patient. Scale bar (200 μm). Healthy (n = 6); AUD normal (n = 6); AUD altered (n = 6). AUD: Alcohol use disorder.
- Citation: Toulehohoun AG, Ambroise J, Illiyas B, Maccioni L, Lupianez J, Manco R, Clerbaux LA, Bouzin C, Schnabl B, Stärkel P. Impairment of the intestinal epithelium barrier through alteration of proliferation and differentiation balance in alcohol use disorder. World J Gastroenterol 2026; 32(28): 118458
- URL: https://www.wjgnet.com/1007-9327/full/v32/i28/118458.htm
- DOI: https://dx.doi.org/10.3748/wjg.118458