
















Copyright: ©Author(s) 2026.
World J Gastroenterol. Jul 21, 2026; 32(27): 119490
Published online Jul 21, 2026. doi: 10.3748/wjg.119490
Published online Jul 21, 2026. doi: 10.3748/wjg.119490
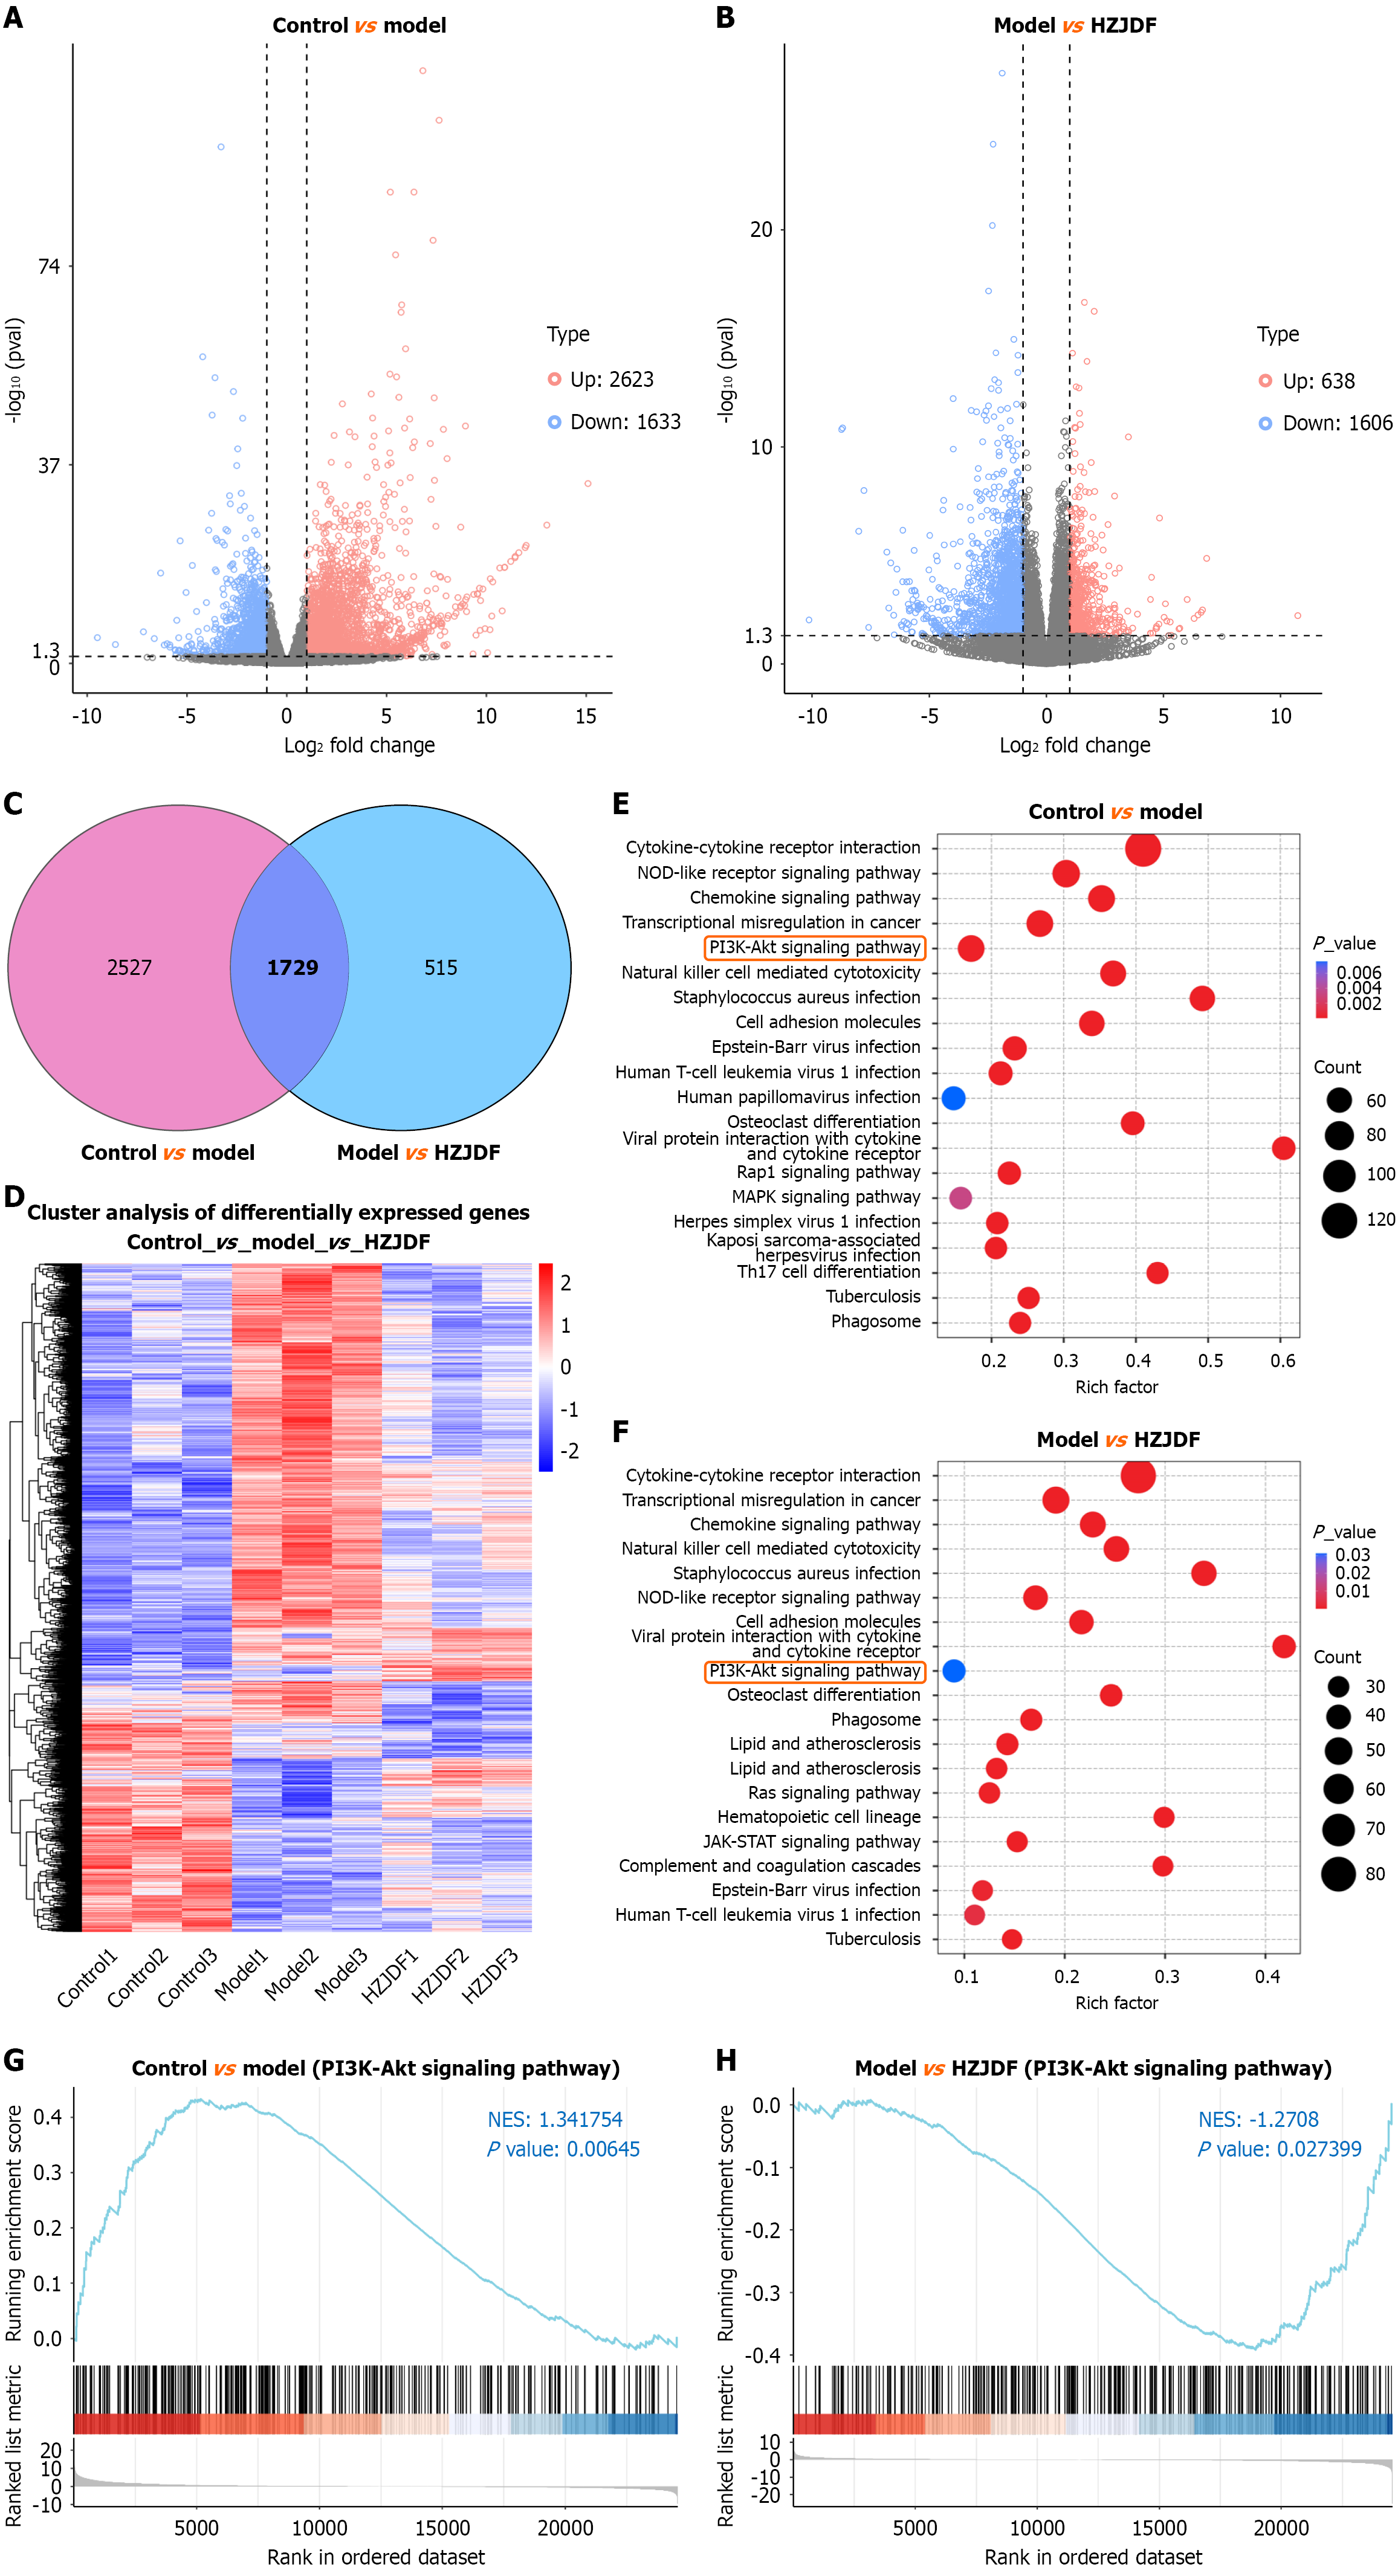
Figure 3 Transcriptomics analysis of Hua-Zhuo-Jie-Du formula against colitis-associated colorectal cancer.
A: Volcano plot of the differentially expressed genes (DEGs) between the control group and model group; B: Volcano plot of the DEGs between the model group and the Hua-Zhuo-Jie-Du formula (HZJDF) group; C: Venn diagram showing the overlapping genes in the control group vs model group and the model group vs HZJDF group; D: Heatmap from cluster analysis of the DEGs among three different groups; E: Bubble plot from Kyoto Encyclopedia of Genes and Genomes (KEGG) enrichment analysis of the genes that were upregulated in the model group compared to the control group; F: Bubble plot from KEGG enrichment analysis of the genes that were downregulated in the HZJDF group compared with the model group; G: Gene set enrichment analysis (GSEA) analysis for comparison of the control group vs model group; H: GSEA analysis for comparison of the model group vs HZJDF group. HZJDF: Hua-Zhuo-Jie-Du formula; MAPK: Mitogen-activated protein kinase; PI3K: Phosphatidylinositol 3-kinase; AKT: Protein kinase B; JAK-STAT: Janus tyrosine kinase/signal transducer and activator of transcription.
- Citation: Hu SP, Cai YR, Liu Y, Guo YX, Jia XM, Jiang JM, Yang Q. Hua-Zhuo-Jie-Du formula alleviates colitis-associated colorectal cancer via regulating phosphatidylinositol 3-kinase/protein kinase B signaling pathway. World J Gastroenterol 2026; 32(27): 119490
- URL: https://www.wjgnet.com/1007-9327/full/v32/i27/119490.htm
- DOI: https://dx.doi.org/10.3748/wjg.119490