
















Copyright: ©Author(s) 2026.
World J Gastroenterol. Jul 21, 2026; 32(27): 118794
Published online Jul 21, 2026. doi: 10.3748/wjg.118794
Published online Jul 21, 2026. doi: 10.3748/wjg.118794
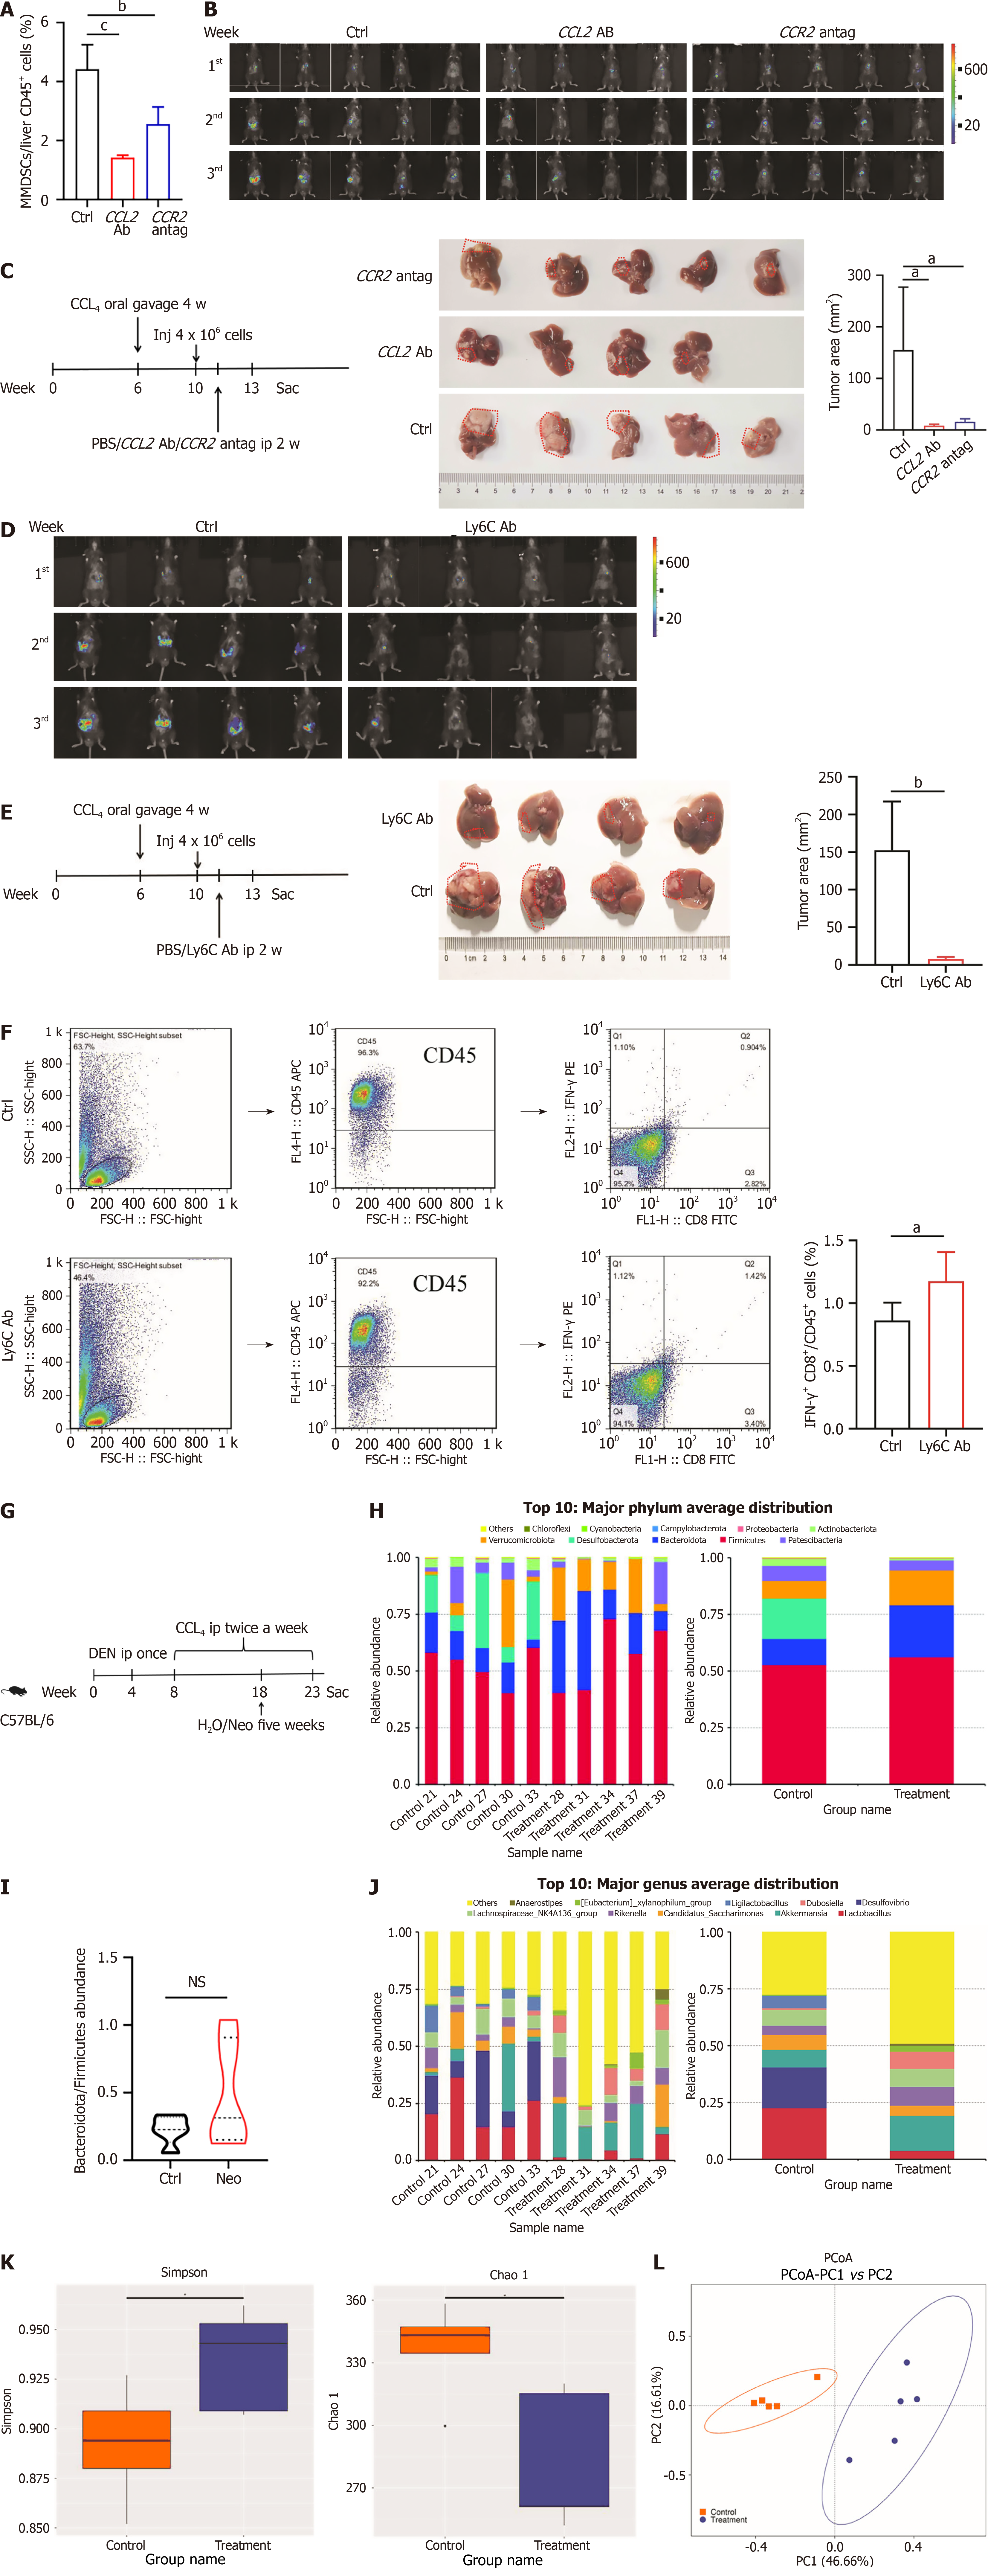
Figure 6 Targeting CCL2/CCR2/monocytic myeloid-derived suppressor cell inhibits tumor growth.
A: The aggregation of monocytic myeloid-derived suppressor cells was detected by flow cytometry in control (Ctrl), CCL2 Ab and CCR2 antag groups; B: Weekly in vivo imaging was performed to monitor tumor growth in Ctrl, CCL2 Ab and CCR2 antag groups; C: The Change of tumor size in Ctrl, CCL2 Ab and CCR2 antag groups by giving animals different interventions (n = 5 for Ctrl and CCR2 antag, 4 for CCL2 Ab); D: Weekly in vivo imaging was performed to monitor tumor growth in Ctrl and Ly6C Ab groups; E: The change of tumor size in Ctrl and Ly6C Ab groups by giving animals different interventions; F: The aggregation of IFN-γ+CD8+T was detected by flow cytometry in Ctrl and Ly6C Ab groups (n = 4 for each group); G: Molding diagram of DEN combination with CCL4 (n = 5 for each group); H: Major phylum average distribution in Ctrl and neomycin groups; I: The ratio of Bacteroidetes/Firmicutes in Ctrl and neomycin groups; J: Major genus average distribution in Ctrl and neomycin groups; K and L: Alpha diversity was evaluated using the Simpson and Chao1 indices, while beta diversity was assessed by principal coordinate analysis, revealing distinct microbial community structures between the Ctrl and neomycin groups. aP < 0.05, bP < 0.01. PBS: Phosphate-buffered saline; PCoA: Principal coordinate analysis; MMDSC: Monocytic myeloid-derived suppressor cell; Ctrl: Control.
- Citation: Zhang Y, Zhou YL, Nie X, Zhang LJ, Xu WW, Wang JQ, Zhao HL, Xu JK, Xu J, Xu HM, Li JH, Huang WQ, Yang J, Yang YX, Zhan Q, Lin Y, Nie YQ. Gram-negative bacteria and endotoxins promote hepatocellular carcinoma progression through the recruitment of myeloid-derived suppressor cells. World J Gastroenterol 2026; 32(27): 118794
- URL: https://www.wjgnet.com/1007-9327/full/v32/i27/118794.htm
- DOI: https://dx.doi.org/10.3748/wjg.118794