
















Copyright: ©Author(s) 2026.
World J Gastroenterol. Jul 21, 2026; 32(27): 118009
Published online Jul 21, 2026. doi: 10.3748/wjg.118009
Published online Jul 21, 2026. doi: 10.3748/wjg.118009
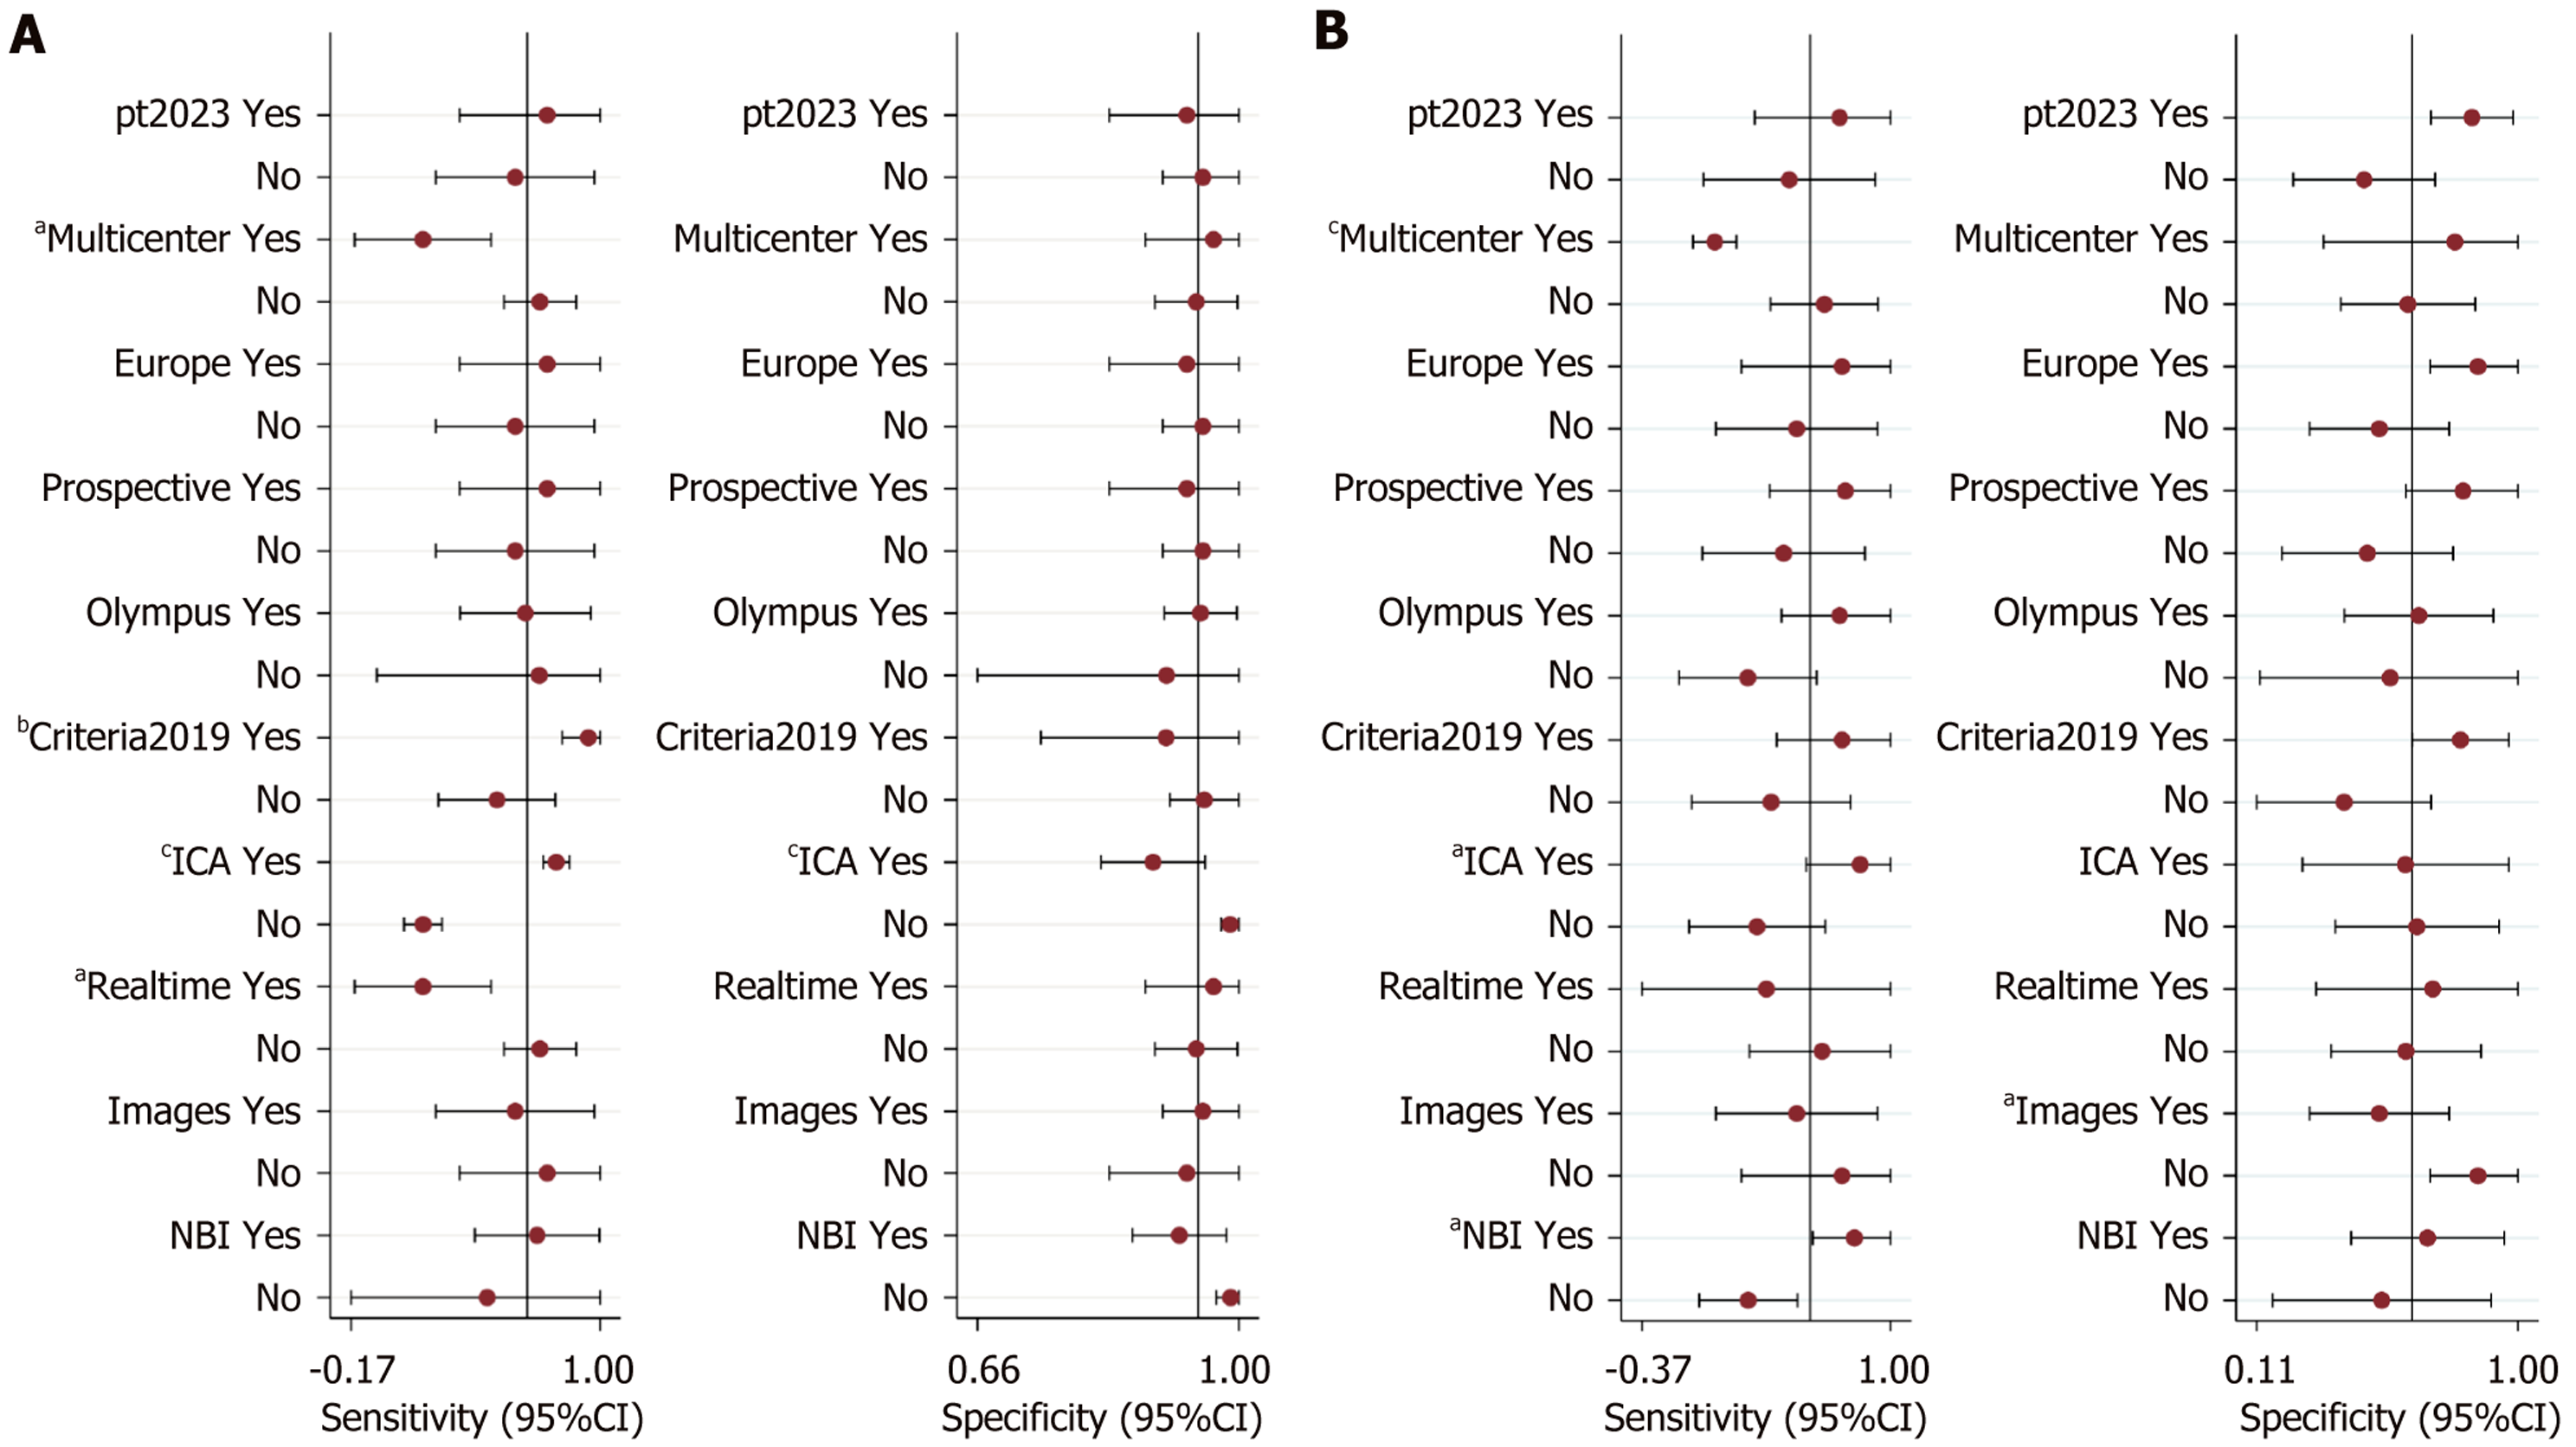
Figure 3 Forest plots of subgroup analysis.
A: Sessile serrated lesions (SSLs) vs non-SSLs; B: SSLs vs hyperplastic polyps. aP < 0.05. bP < 0.01. cP < 0.001. CI: Confidence interval; pt: Publication time; ICA: Image classification algorithms; NBI: Narrow band imaging.
- Citation: Zhang S, Wang SH, Zhao YD, Wei JH, Sui XY, Li X, Zhang HW, Huang ZY, Wang CL, Hu H, Zhang J, Li ZS, Zhao SB, Bai Y. Performance of computer-aided diagnosis for colorectal sessile serrated lesions: A systematic review and meta-analysis. World J Gastroenterol 2026; 32(27): 118009
- URL: https://www.wjgnet.com/1007-9327/full/v32/i27/118009.htm
- DOI: https://dx.doi.org/10.3748/wjg.118009