
















Copyright: ©Author(s) 2026.
World J Gastroenterol. Jul 21, 2026; 32(27): 117897
Published online Jul 21, 2026. doi: 10.3748/wjg.117897
Published online Jul 21, 2026. doi: 10.3748/wjg.117897
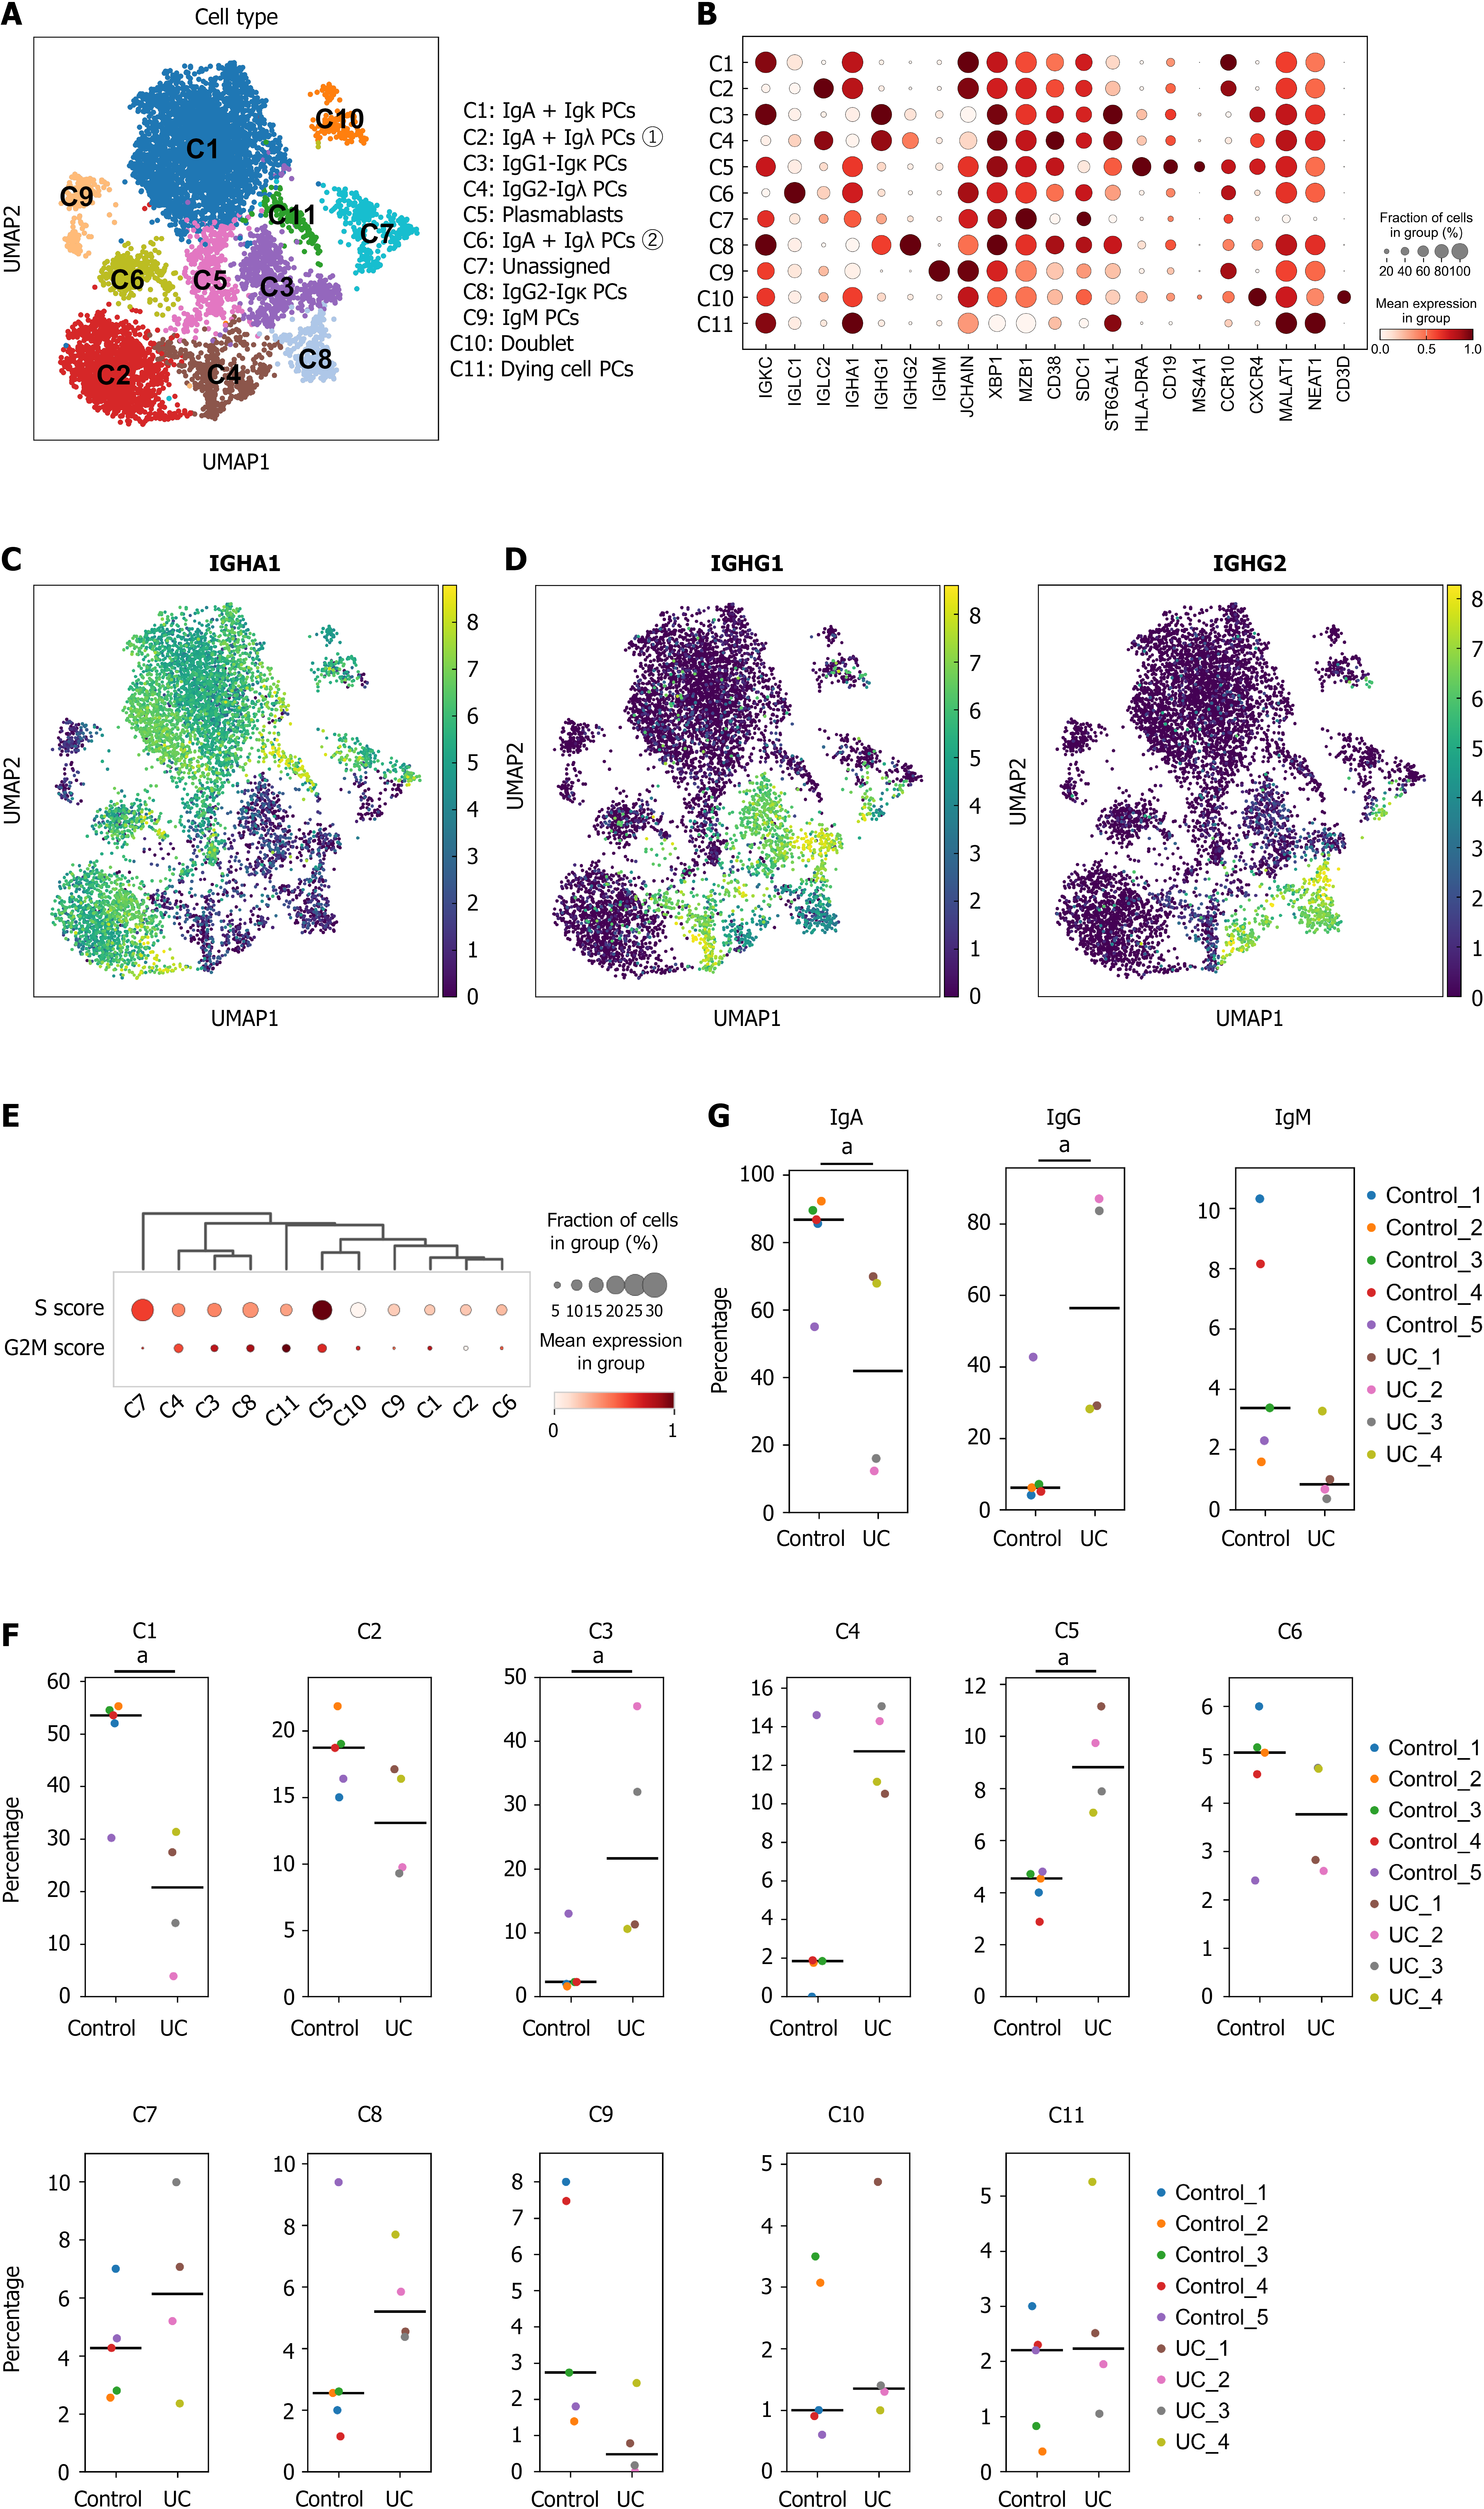
Figure 3 Aberrant immunoglobulin G production in the appendices of patients with ulcerative colitis.
A: Uniform manifold approximation and projection (UMAP); unsupervised clustering of appendiceal plasma cells; B: Dot plot; expression frequencies and signature gene levels across clusters; C: Im
- Citation: Izutani Y, Ogino T, Sakakibara S, Kishi Y, Liu YC, Nakano Y, Fukada A, Sekido Y, Kuwahara R, Kihara T, Takeda M, Hata T, Hamabe A, Miyoshi N, Uemura M, Ikeuchi H, Hirota S, Takeda K, Mizushima T, Okuzaki D, Doki Y, Eguchi H. Contribution of the appendix to ulcerative colitis by supplying pathogenic immunoglobulin G-producing cells. World J Gastroenterol 2026; 32(27): 117897
- URL: https://www.wjgnet.com/1007-9327/full/v32/i27/117897.htm
- DOI: https://dx.doi.org/10.3748/wjg.117897