
















Copyright: ©Author(s) 2026.
World J Gastroenterol. Jul 14, 2026; 32(26): 118957
Published online Jul 14, 2026. doi: 10.3748/wjg.v32.i26.118957
Published online Jul 14, 2026. doi: 10.3748/wjg.v32.i26.118957
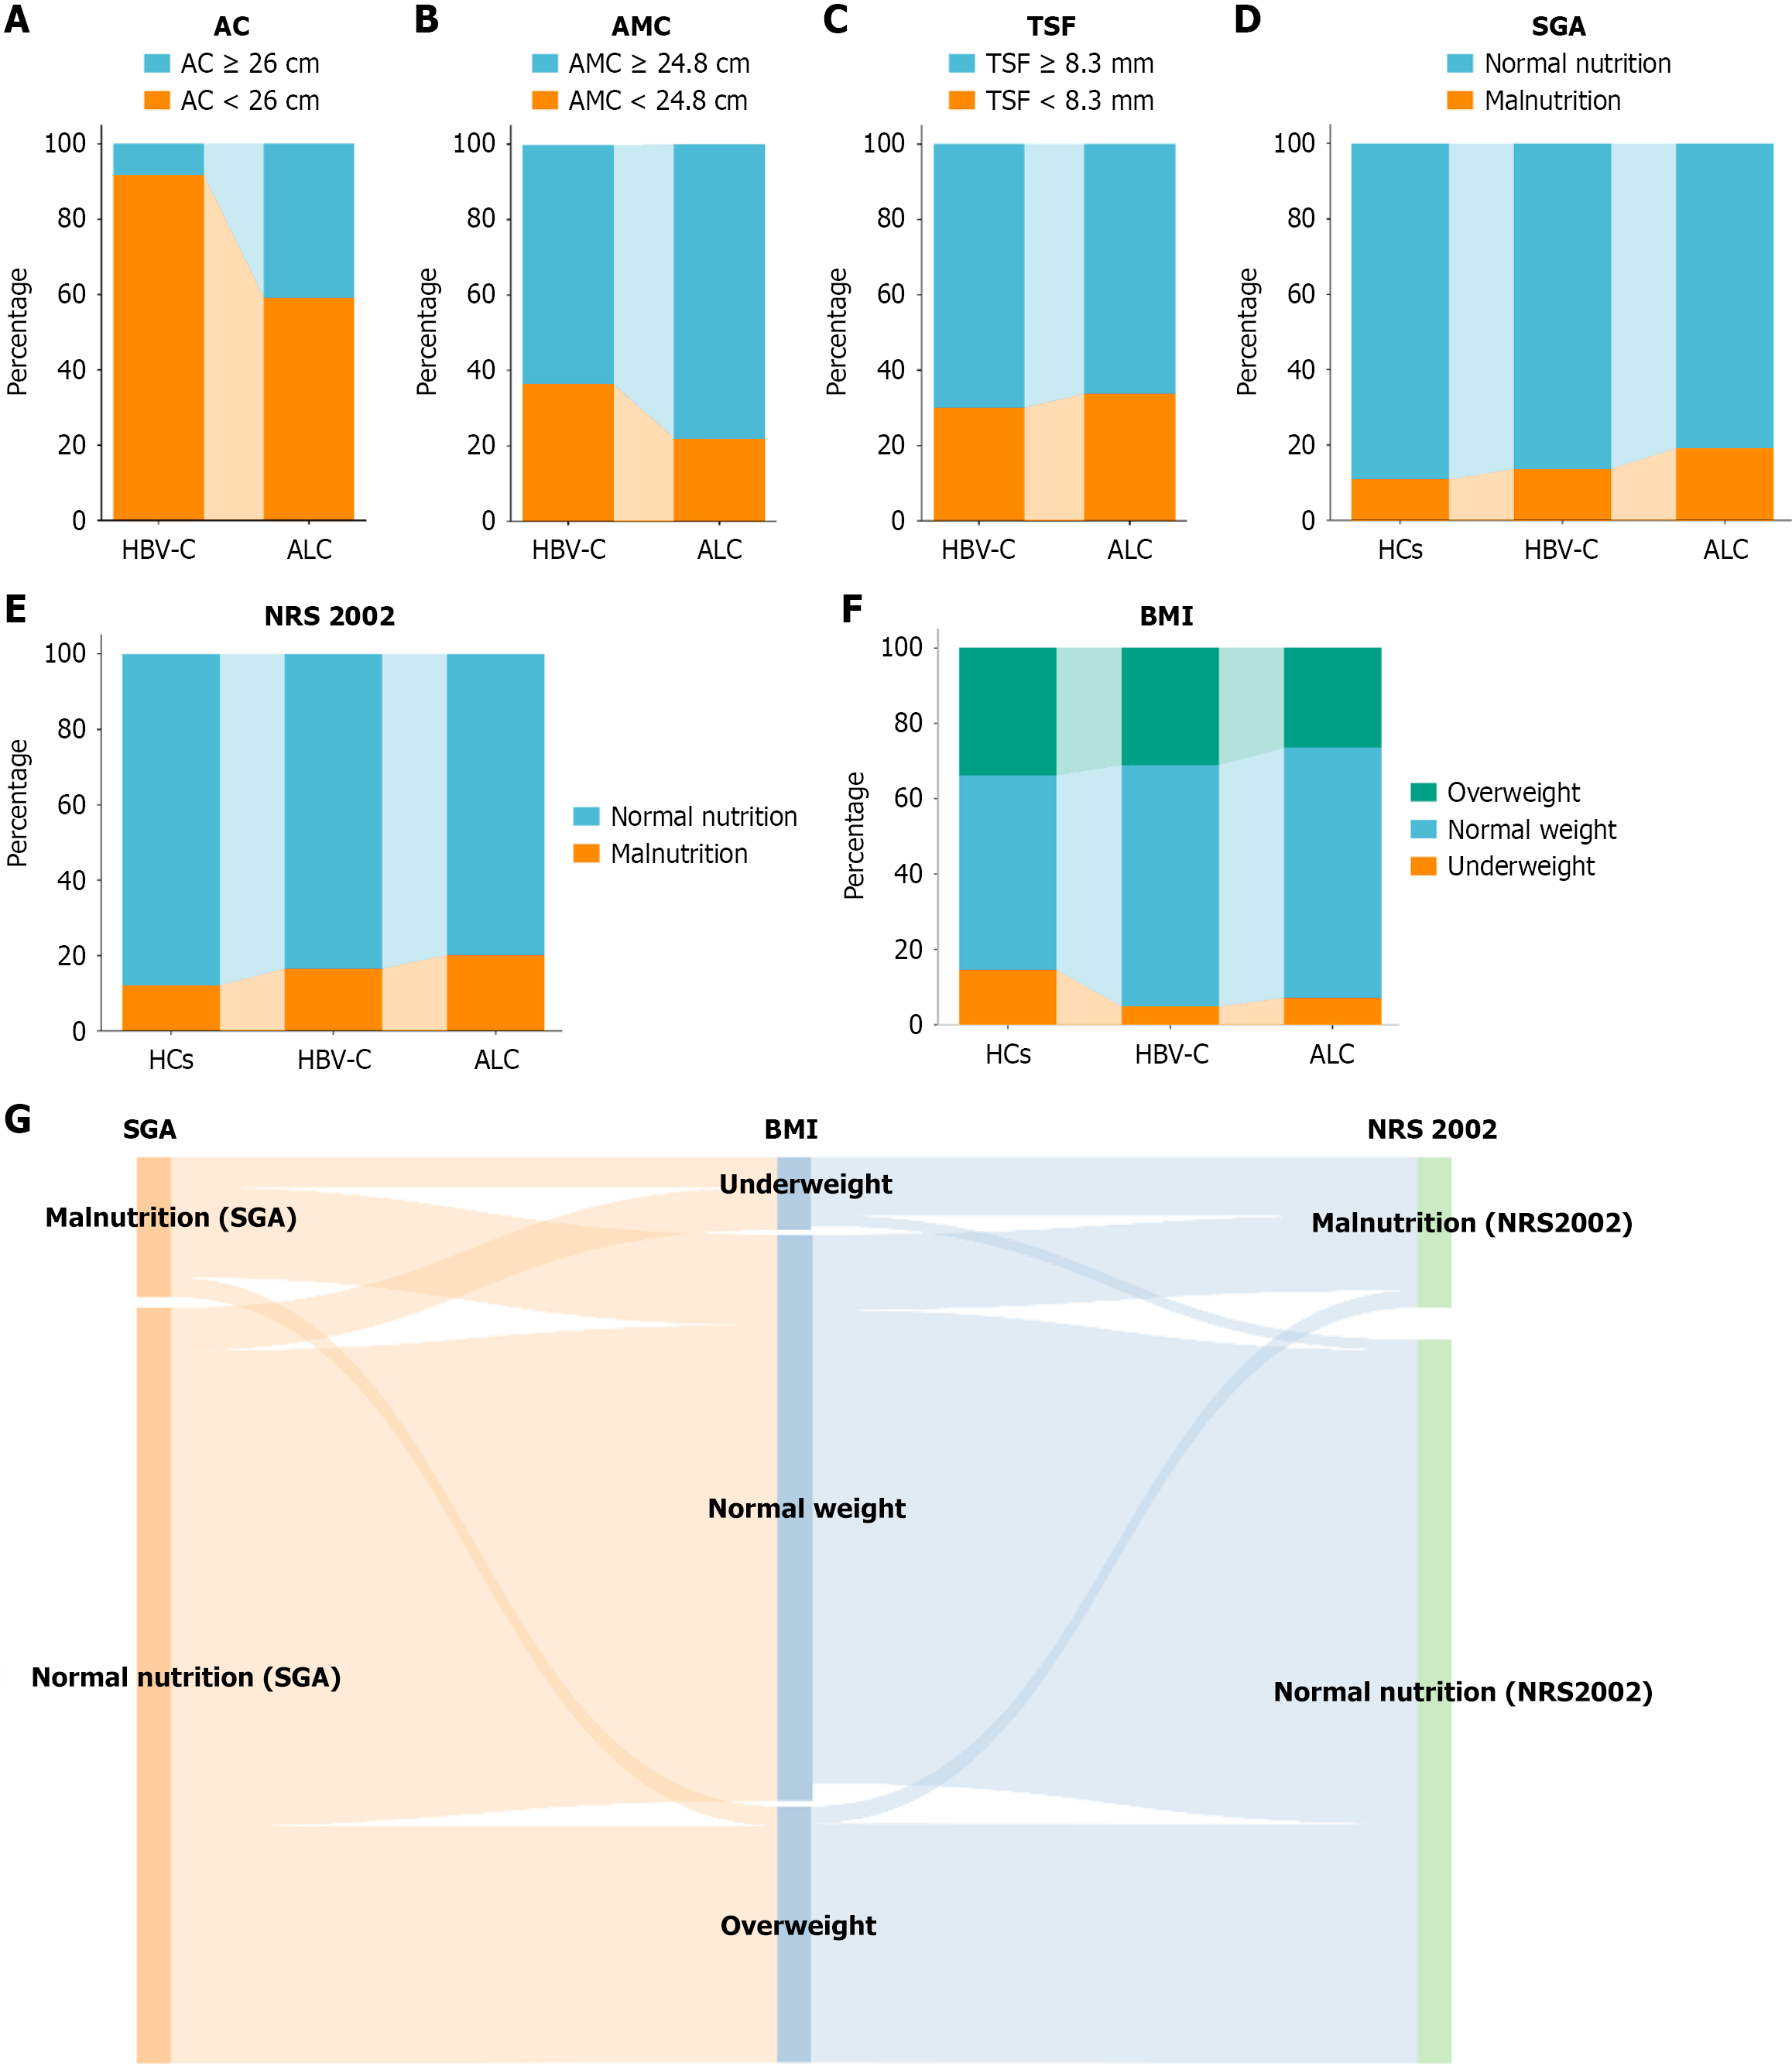
Figure 4 Comparison of nutritional status among the healthy controls, hepatitis B virus-related cirrhosis, and alcoholic liver cirrhosis groups.
Percentage of patients with normal nutritional status and malnutrition assessed by anthropometric measurements and nutritional assessment tools according to standard cutoff values. A: Mid-arm circumference; B: Mid-arm muscular circumference; C: Triceps skinfold; D: Subjective global assessment (SGA) score; E: Nutritional risk screening 2002 (NRS-2002) score; F: Percentage of patients categorized as overweight, normal weight, and underweight based on body mass index (BMI) in healthy controls (HCs), hepatitis B virus-related cirrhosis (HBV-C), and alcoholic liver cirrhosis (ALC) groups; G: Comparison of SGA scores, BMI, and NRS 2002 scores showing visual comparisons of nutritional status and BMI categories among HCs, HBV-C, and ALC groups. AC: Mid-arm circumference; AMC: Mid-arm muscular circumference; TSF: Triceps skinfold; ALC: Alcoholic liver cirrhosis; HBV-C: Hepatitis B virus-related cirrhosis; HCs: Healthy controls; BMI: Body mass index; SGA: Subjective global assessment; NRS-2002: Nutritional risk screening 2002.
- Citation: Wu XQ, Liu YY, Yu HS, Abassa KK, Pan LL, Ke BL, Guo YW. Clinical assessment of malnutrition among patients with alcoholic liver cirrhosis: A single-center study in Southern China. World J Gastroenterol 2026; 32(26): 118957
- URL: https://www.wjgnet.com/1007-9327/full/v32/i26/118957.htm
- DOI: https://dx.doi.org/10.3748/wjg.v32.i26.118957