
















Copyright: ©Author(s) 2026.
World J Gastroenterol. Jul 14, 2026; 32(26): 118957
Published online Jul 14, 2026. doi: 10.3748/wjg.v32.i26.118957
Published online Jul 14, 2026. doi: 10.3748/wjg.v32.i26.118957
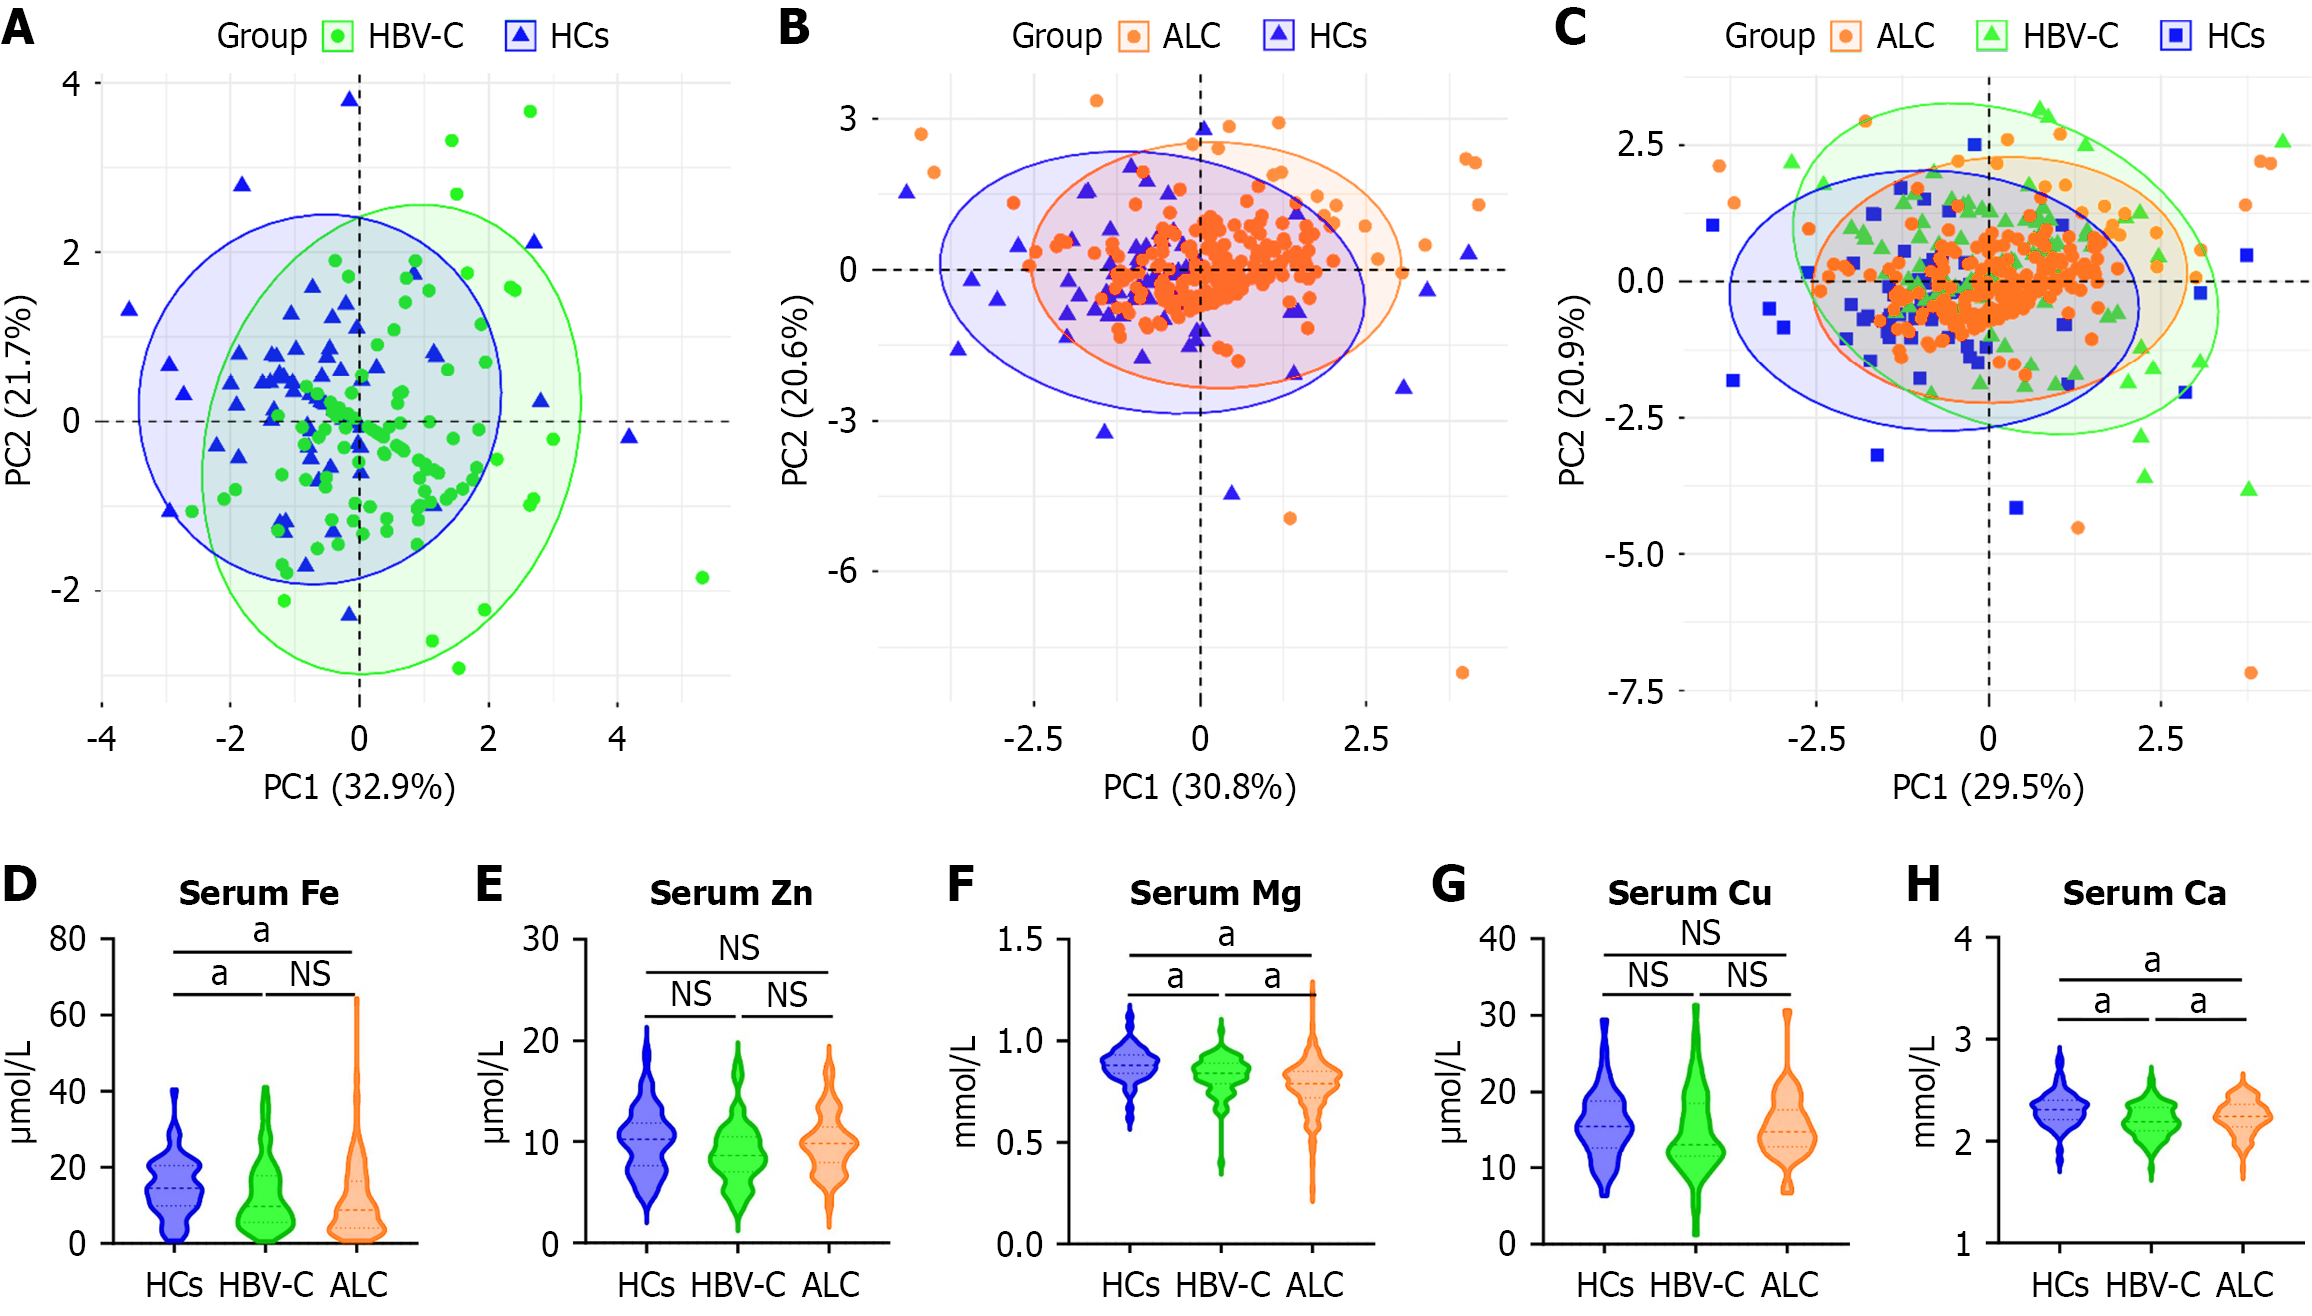
Figure 2 Principal component analysis and serum trace element profiles distinguish cirrhosis etiologies.
A-C: Principal component analysis of serum trace elements showing metabolic separation between groups. Hepatitis B virus-related cirrhosis (HBV-C) vs healthy controls (HCs) (A). Alcoholic liver cirrhosis (ALC) vs HCs (B). Among ALC, HBV-C, and HCs (C). Individual samples are shown as points with 95% confidence ellipses; principal components and explained variance (%) are labeled; D-H: Violin plots of serum trace elements. Iron (D); zinc (E); magnesium (F); copper (G); calcium (H). Horizontal lines indicate medians and interquartile ranges. aP < 0.05. NS: Not significant; ALC: Alcoholic liver cirrhosis; HBV-C: Hepatitis B virus-related cirrhosis; HCs: Healthy controls; PC: Principal component; Fe: Iron; Zn: Zinc; Mg: Magnesium; Cu: Copper; Ca: Calcium.
- Citation: Wu XQ, Liu YY, Yu HS, Abassa KK, Pan LL, Ke BL, Guo YW. Clinical assessment of malnutrition among patients with alcoholic liver cirrhosis: A single-center study in Southern China. World J Gastroenterol 2026; 32(26): 118957
- URL: https://www.wjgnet.com/1007-9327/full/v32/i26/118957.htm
- DOI: https://dx.doi.org/10.3748/wjg.v32.i26.118957