
















Copyright: ©Author(s) 2026.
World J Gastroenterol. Jul 14, 2026; 32(26): 117924
Published online Jul 14, 2026. doi: 10.3748/wjg.117924
Published online Jul 14, 2026. doi: 10.3748/wjg.117924
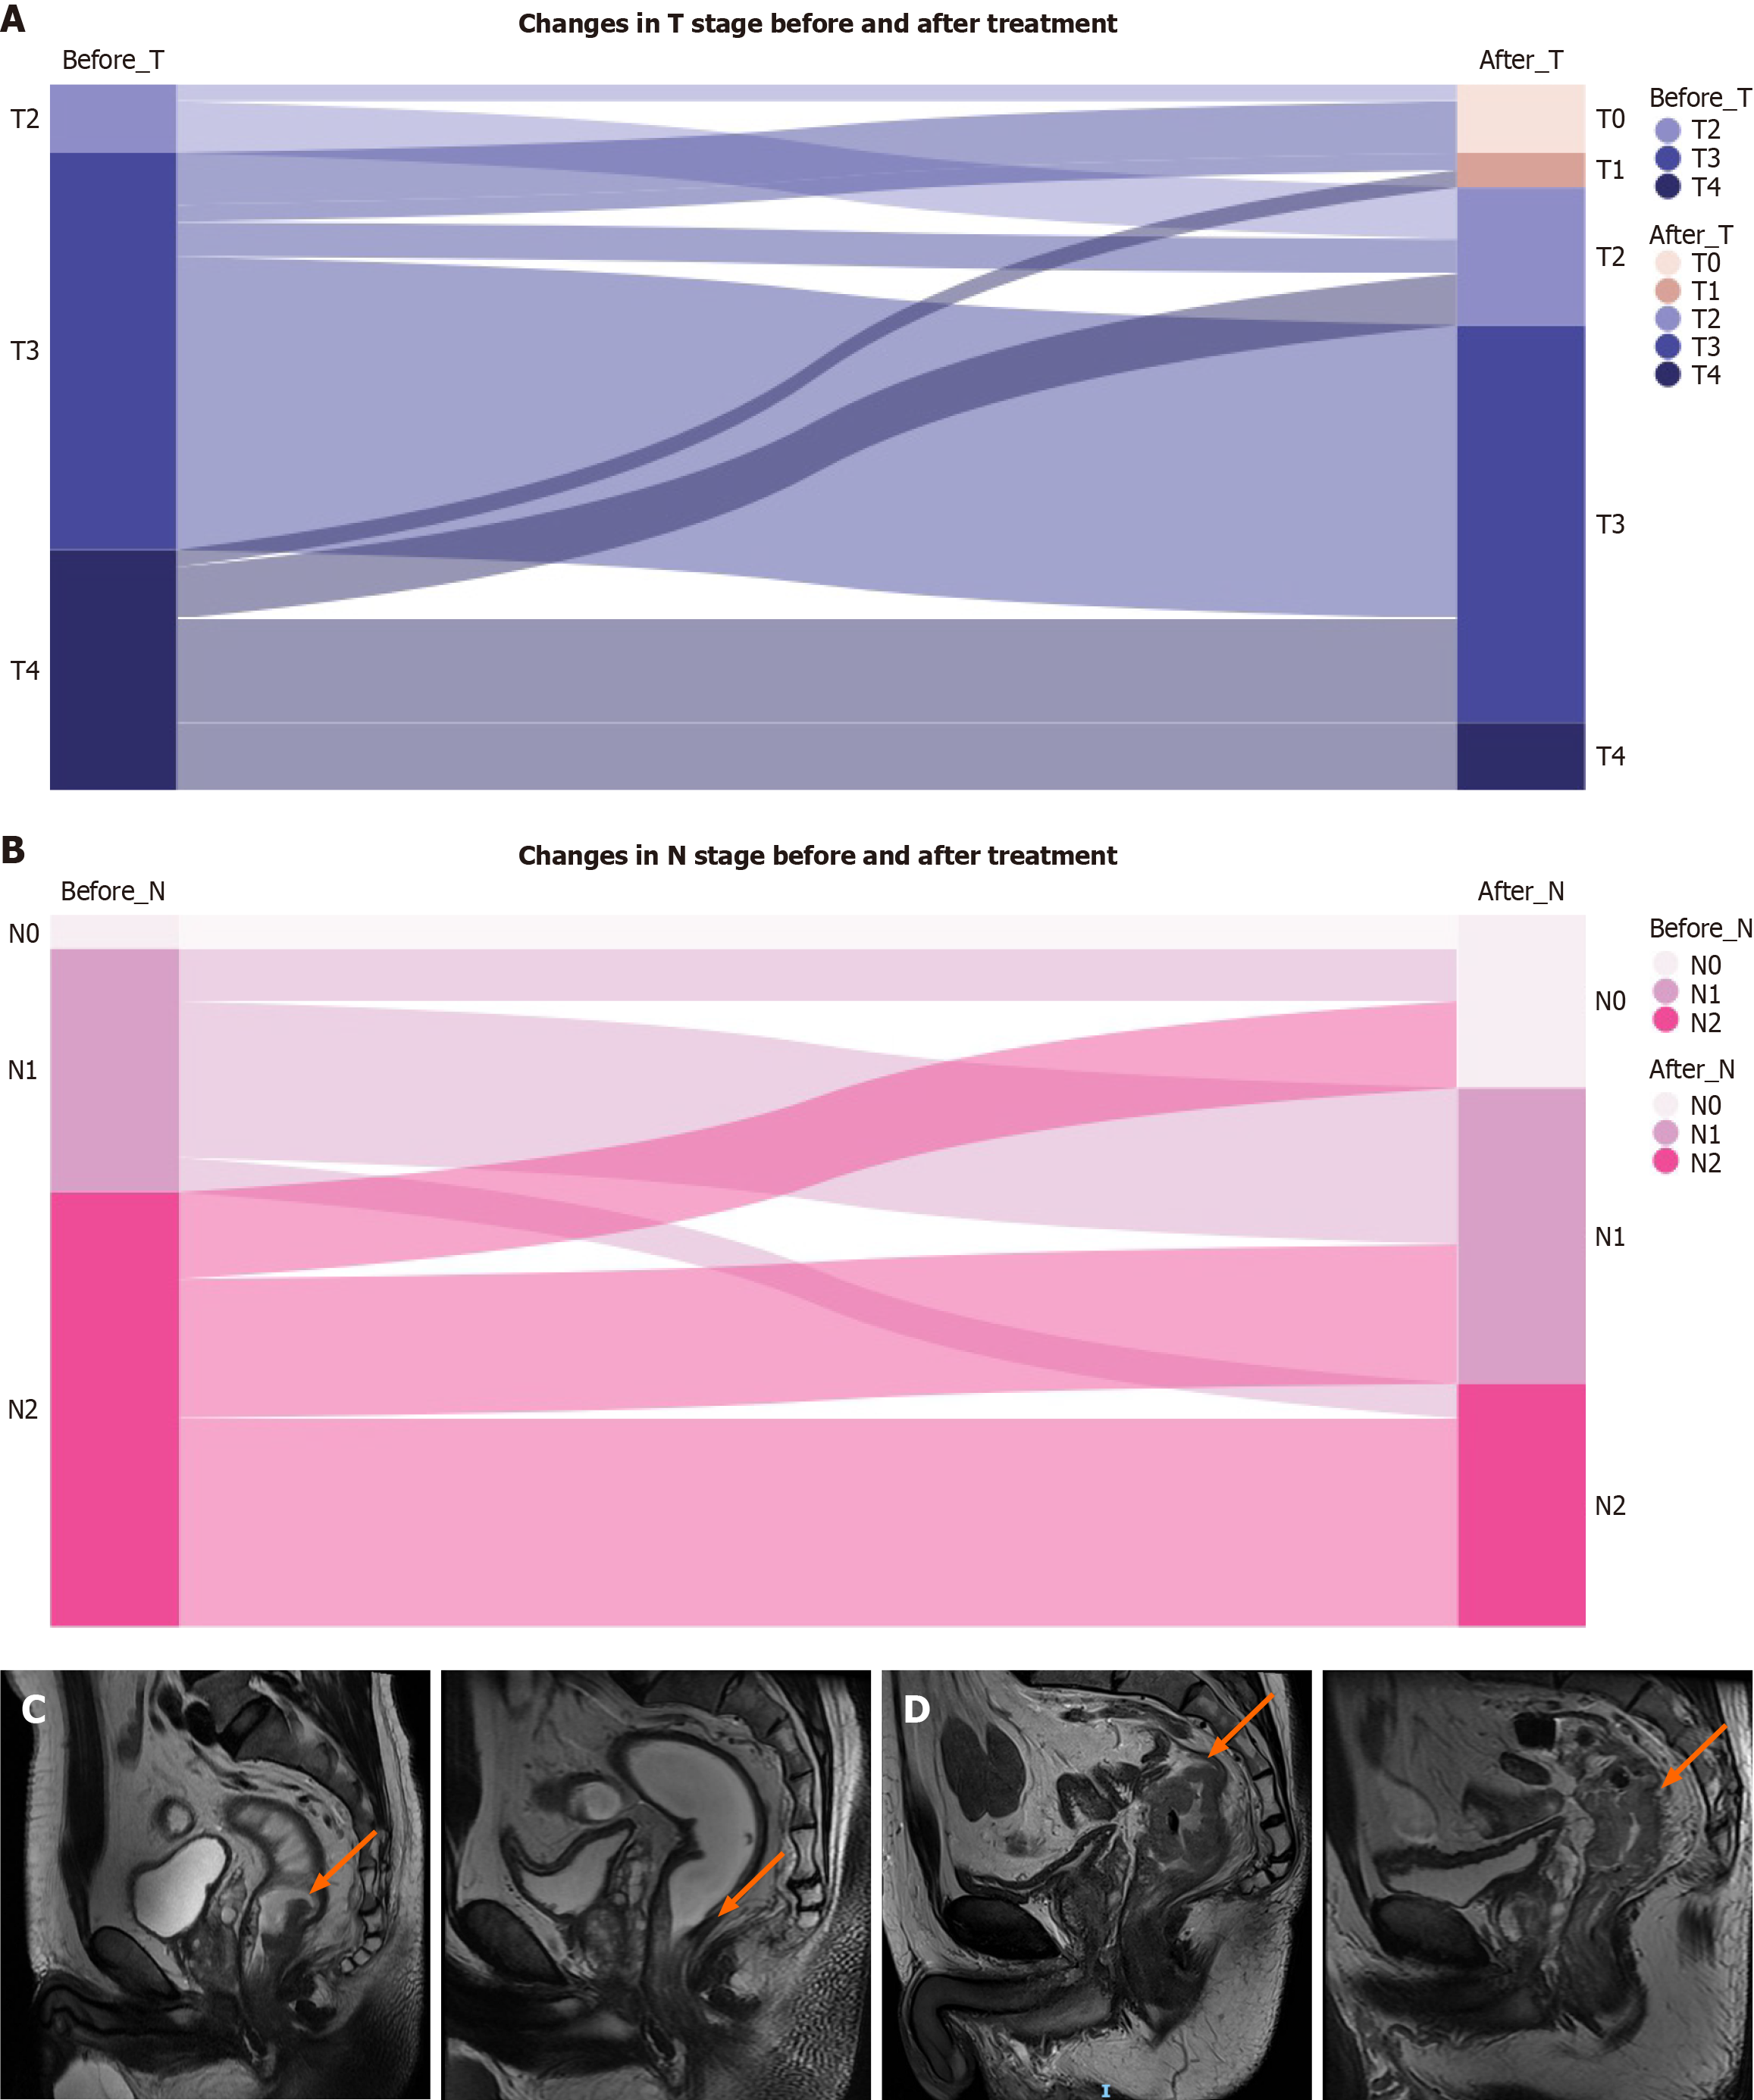
Figure 3 Analysis of multifactorial clinical risk assessment factors.
A: Changes of before treatment T stage to after treatment T stage in 41 patients who reached the surgery; B: Changes of before treatment N stage to after treatment N stage in 41 patients who reached the surgery; C: Rectal magnetic resonance imaging evaluation of pathological complete response rate patients before and after treatment; D: Rectal magnetic resonance imaging evaluation of non-pathological complete response rate patients before and after treatment. In C and D, the orange arrows indicate tumor location and size, with the left arrows representing pre-treatment findings and the right arrows representing post-treatment findings.
- Citation: Qiang WD, Wei Q, Yang B, Chen WJ, Lin CQ, Li YX. Radiotherapy-free neoadjuvant strategy using sintilimab plus XELOX in locally advanced rectal cancer: A single-arm phase II trial. World J Gastroenterol 2026; 32(26): 117924
- URL: https://www.wjgnet.com/1007-9327/full/v32/i26/117924.htm
- DOI: https://dx.doi.org/10.3748/wjg.117924