
















Copyright: ©Author(s) 2026.
World J Gastroenterol. Jul 7, 2026; 32(25): 118842
Published online Jul 7, 2026. doi: 10.3748/wjg.118842
Published online Jul 7, 2026. doi: 10.3748/wjg.118842
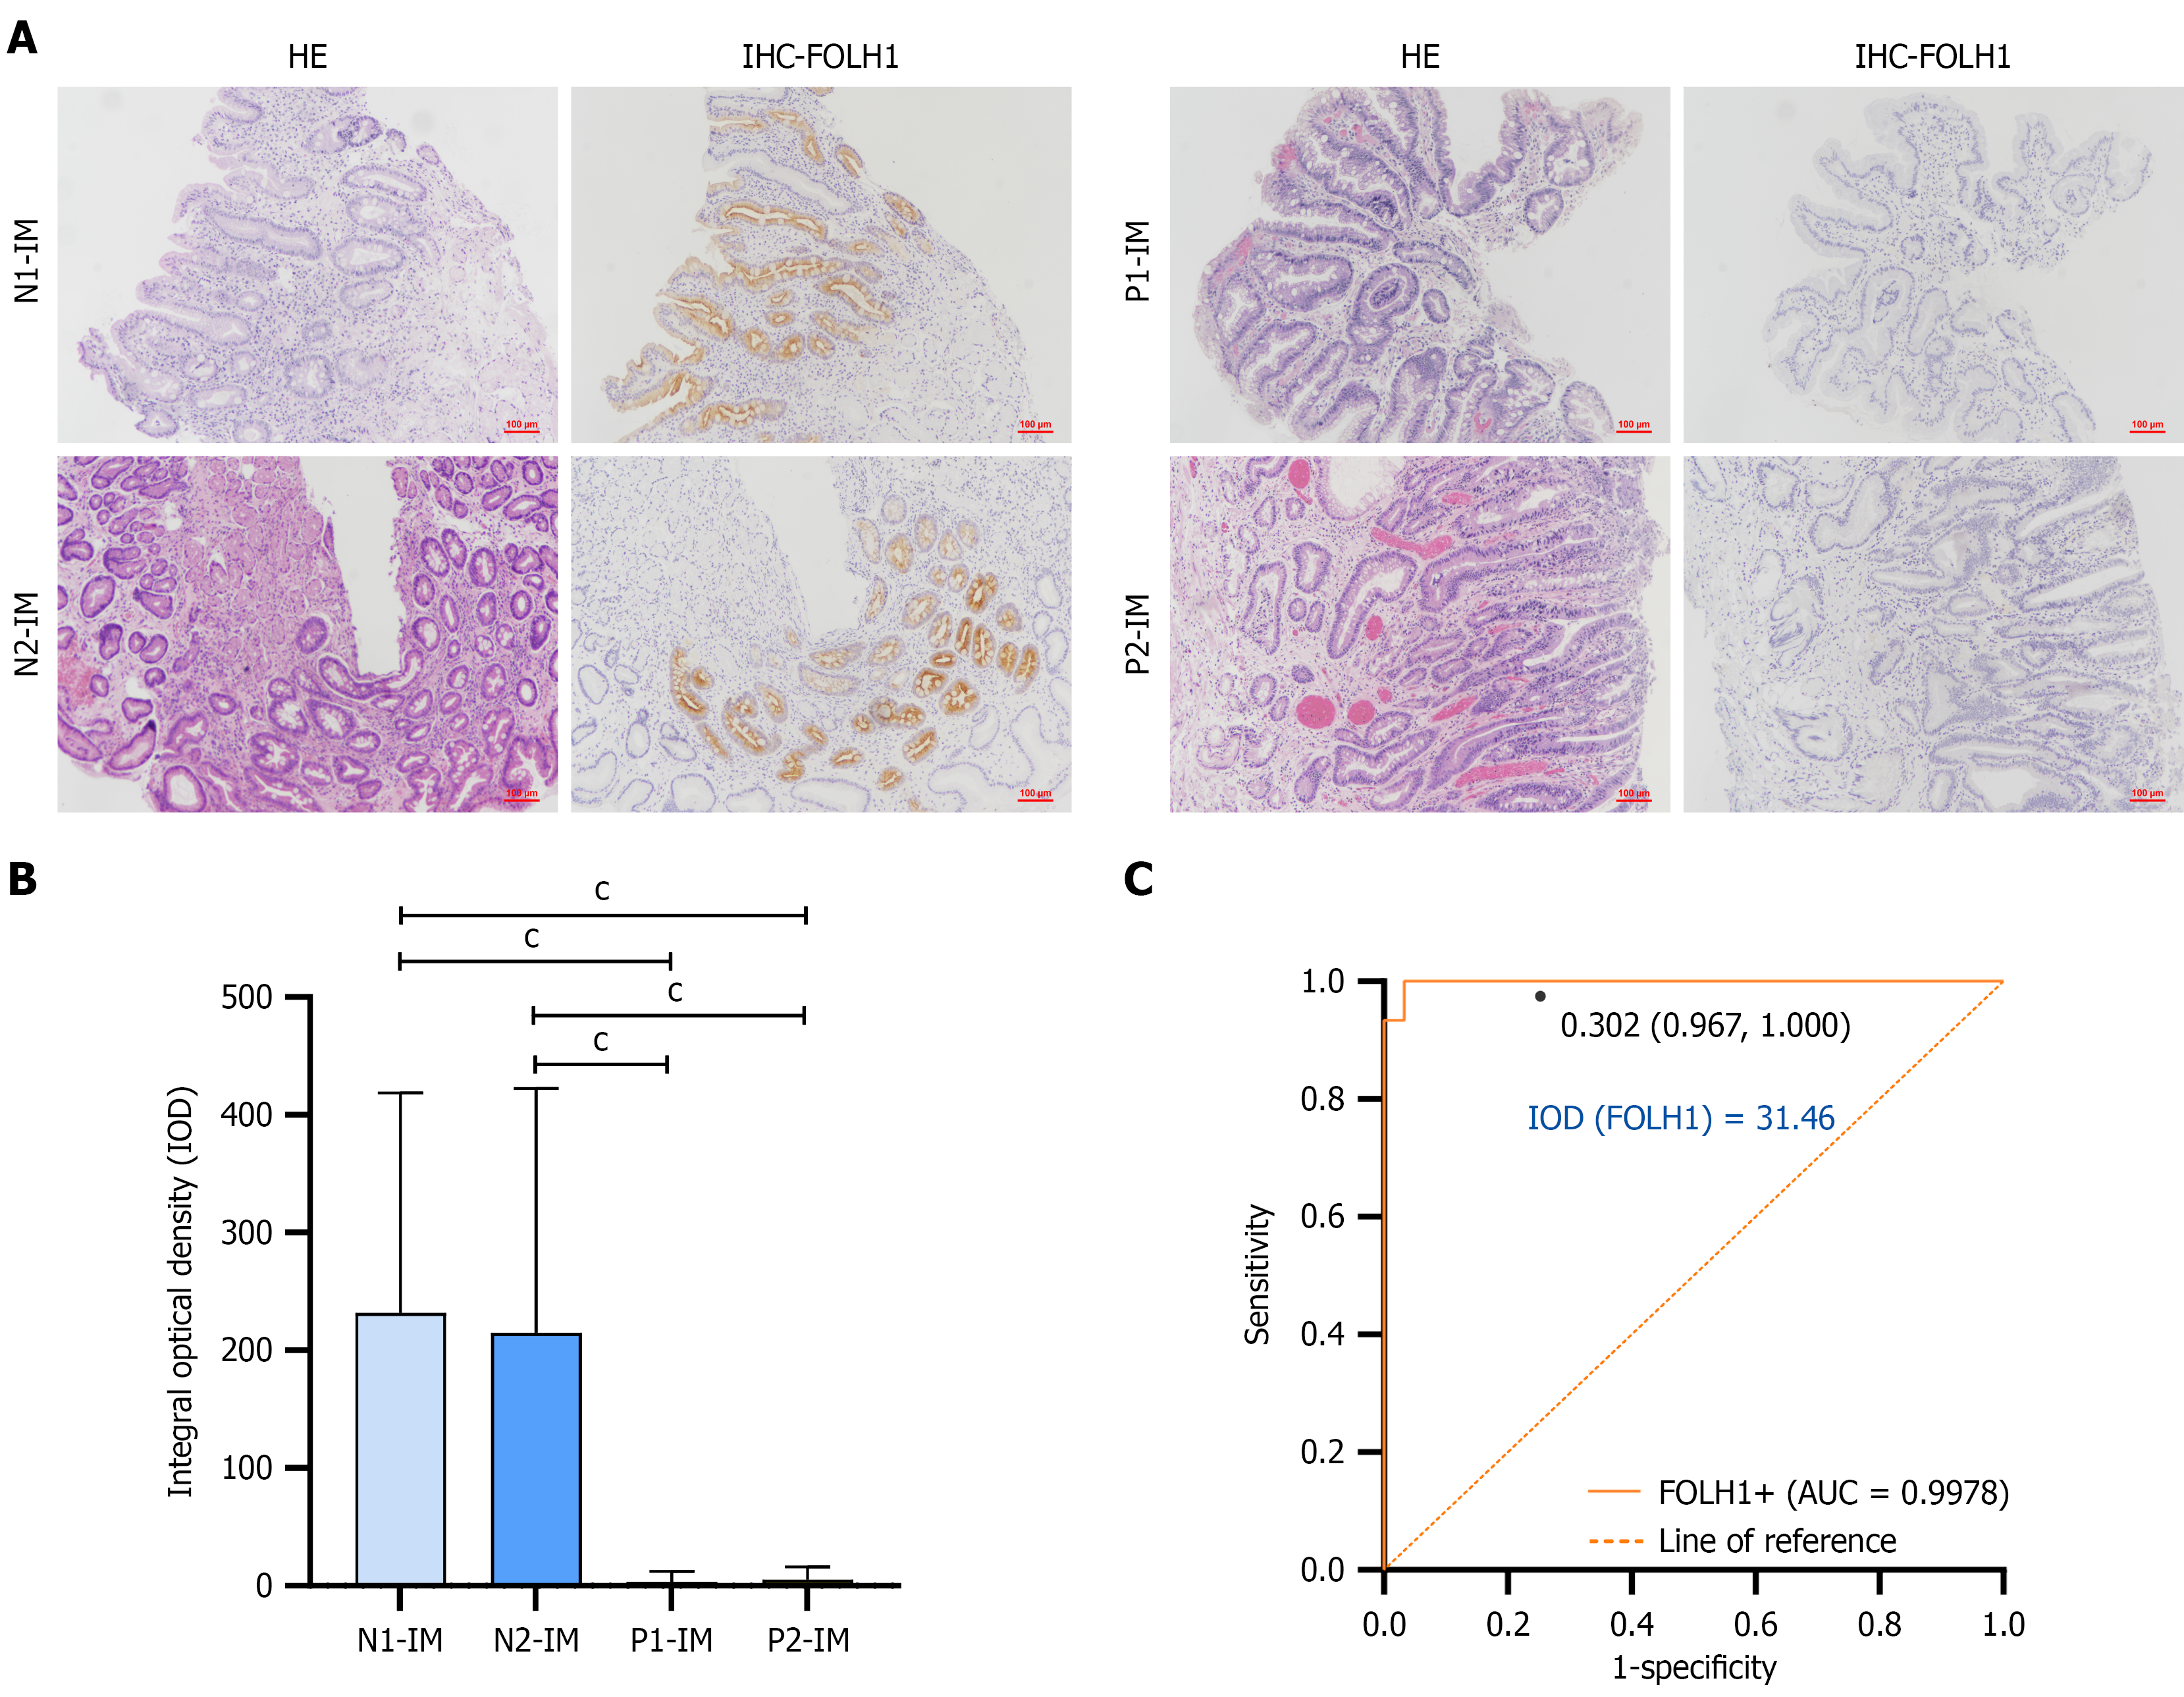
Figure 6 Hematoxylin-eosin and immunohistochemical staining of FOLH1 in 60 additional gastric intestinal metaplasia patients.
A: Positive staining of FOLH1 (brown color) was significantly higher in the epithelium of [non-progression group (N)] N1-intestinal metaplasia (IM), compared to progression group (P group) P1-IM; B: Integrated optical density (IOD) of FOLH1 expression in different groups: N1-IM, N2-IM, P1-IM, and P2-IM; C: The diagnostic cutoff value for FOLH1 is 0.302, a sensitivity of 1.0, and a specificity of 0.967, respectively. The corresponding IOD value for FOLH1 is 31.46. cP < 0.001. HE: Hematoxylin-eosin; IHC: Immunohistochemical; N group: Non-progression group; P group: Progression group; IM: Intestinal metaplasia; IOD: Integrated optical density; AUC: Area under the curve.
- Citation: He S, Guo XF, Wang Y, Bai JQ, Wang JP, Shi JH, Shi YY, Yuan J, Wei W, Yang Y, Shi XH, Feng Y, Ding X, Gao W, Lu D, Zhou WX, Zhang P. FOLH1 as a novel biomarker for risk stratification in gastric intestinal metaplasia. World J Gastroenterol 2026; 32(25): 118842
- URL: https://www.wjgnet.com/1007-9327/full/v32/i25/118842.htm
- DOI: https://dx.doi.org/10.3748/wjg.118842