
















Copyright: ©Author(s) 2026.
World J Gastroenterol. Jul 7, 2026; 32(25): 118842
Published online Jul 7, 2026. doi: 10.3748/wjg.118842
Published online Jul 7, 2026. doi: 10.3748/wjg.118842
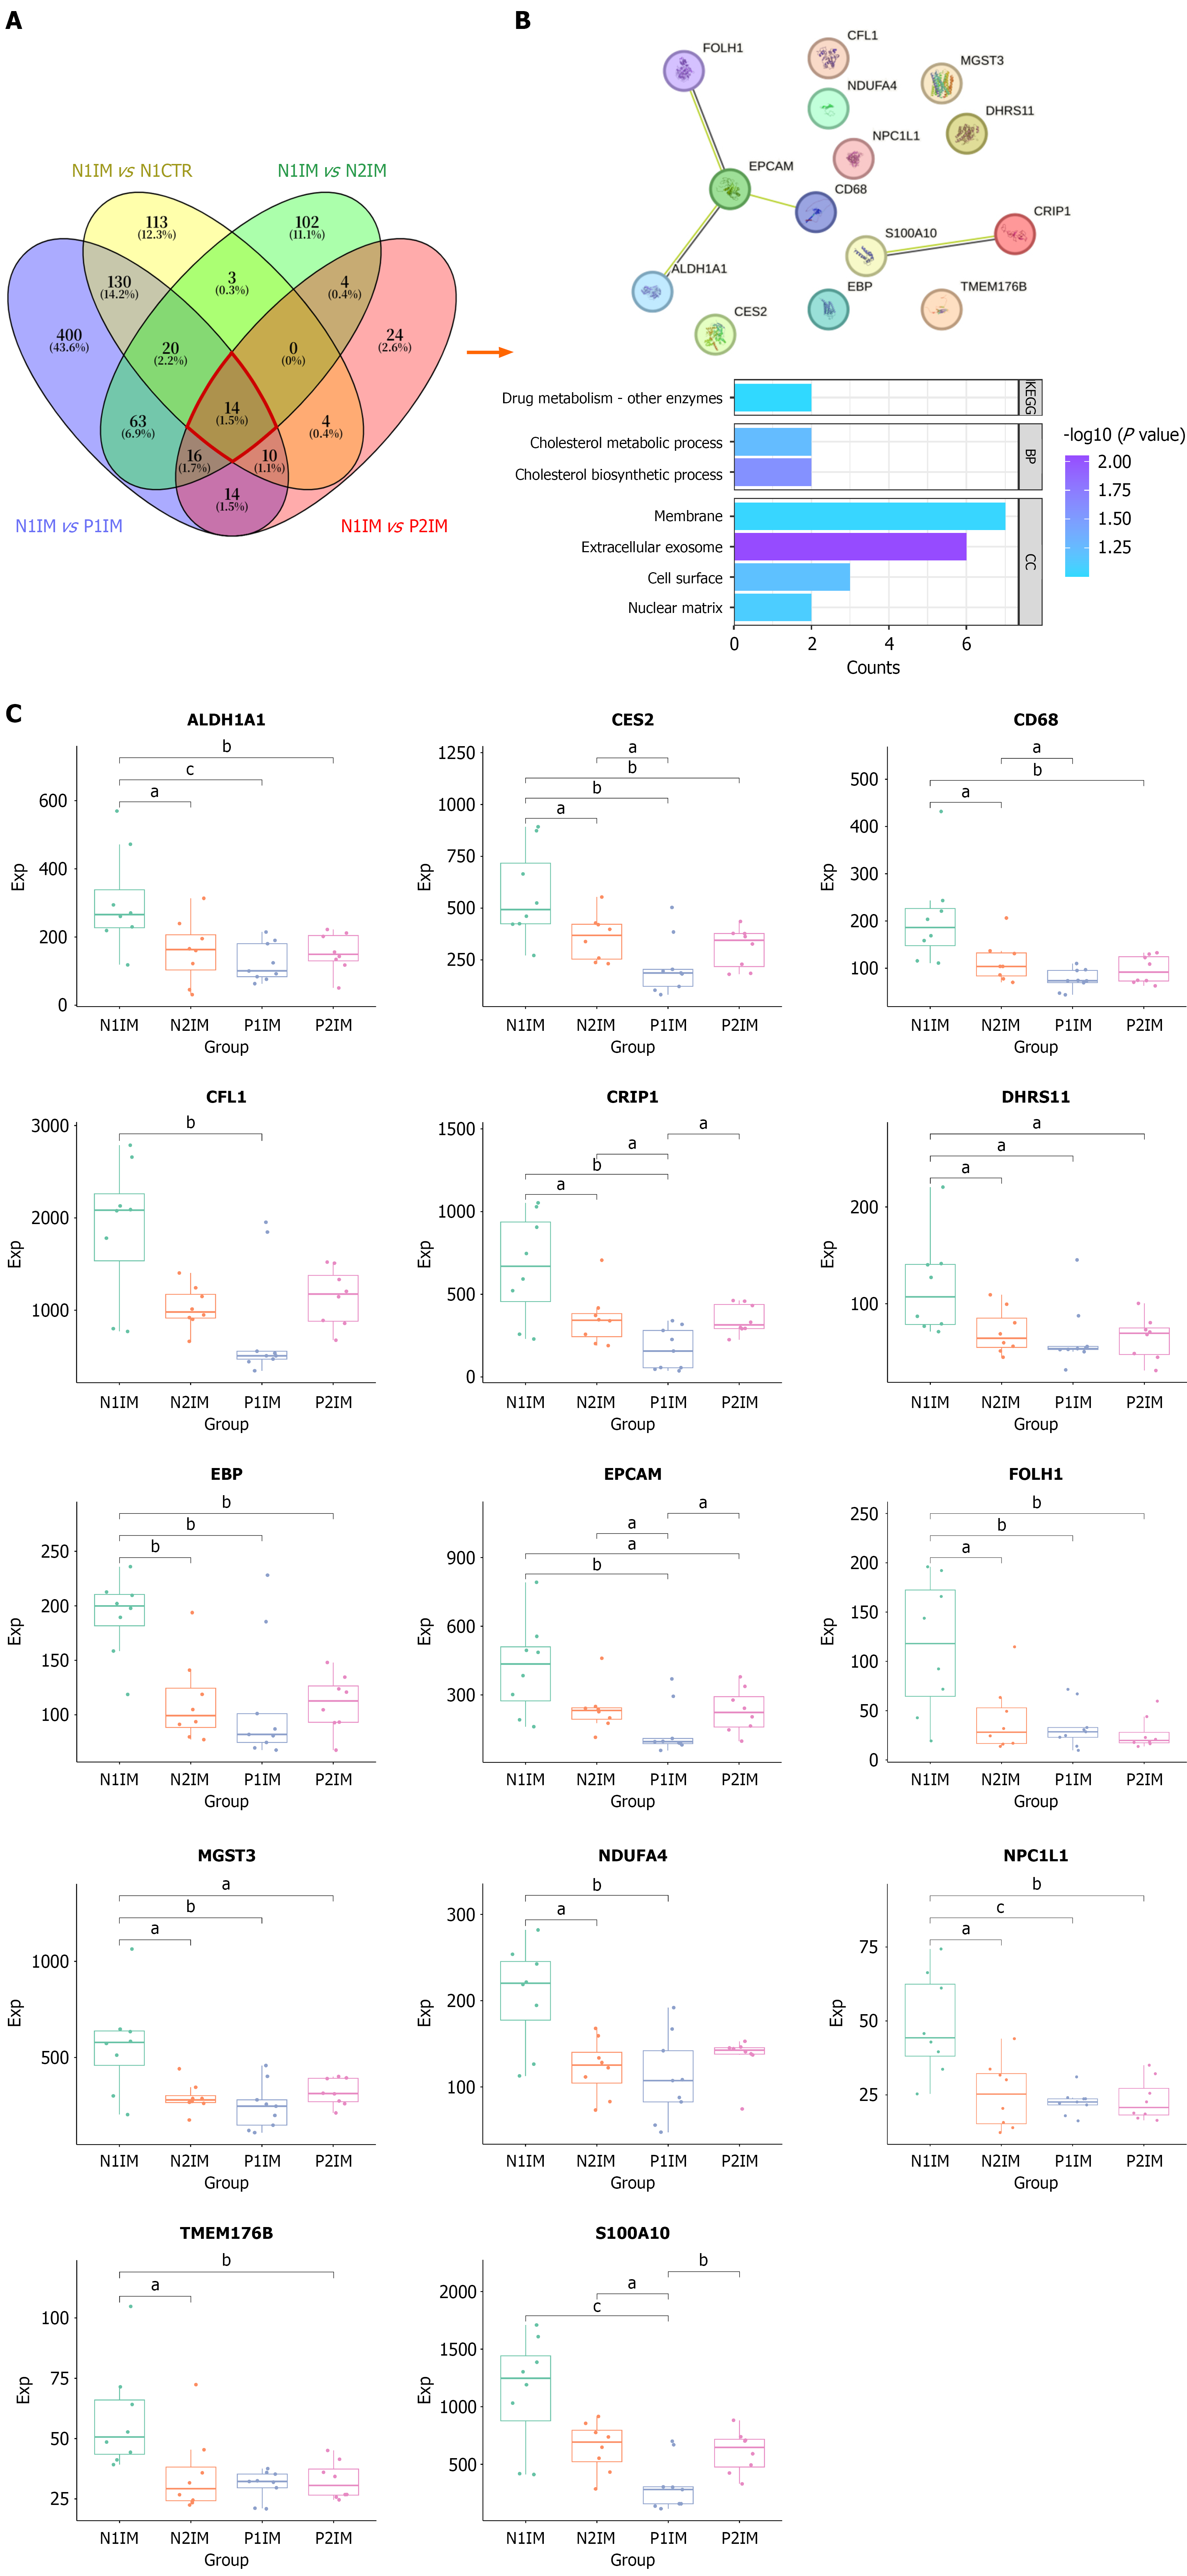
Figure 4 A total of 14 genes were identified as enriched in the pan-cytokeratin region.
A: Overlap of significantly differentially expressed genes in the pan-cytokeratin region between [non-progression group (N)] N1-intestinal metaplasia (IM) and N1-containing normal tissue, N1-IM and N2-IM, N1-IM and progression group (P group) P1-IM, and N1-IM and P2-IM; B: The protein-protein interaction network from the String Database based on 14 significantly differentially expressed genes and enrichment analysis results of these genes; C: The expression levels of 14 genes are shown by boxplots. P compared to N1-IM. aP < 0.05. bP < 0.01. cP < 0.001. N group: Non-progression group; P group: Progression group; IM: Intestinal metaplasia.
- Citation: He S, Guo XF, Wang Y, Bai JQ, Wang JP, Shi JH, Shi YY, Yuan J, Wei W, Yang Y, Shi XH, Feng Y, Ding X, Gao W, Lu D, Zhou WX, Zhang P. FOLH1 as a novel biomarker for risk stratification in gastric intestinal metaplasia. World J Gastroenterol 2026; 32(25): 118842
- URL: https://www.wjgnet.com/1007-9327/full/v32/i25/118842.htm
- DOI: https://dx.doi.org/10.3748/wjg.118842