
















Copyright: ©Author(s) 2026.
World J Gastroenterol. Jul 7, 2026; 32(25): 118842
Published online Jul 7, 2026. doi: 10.3748/wjg.118842
Published online Jul 7, 2026. doi: 10.3748/wjg.118842
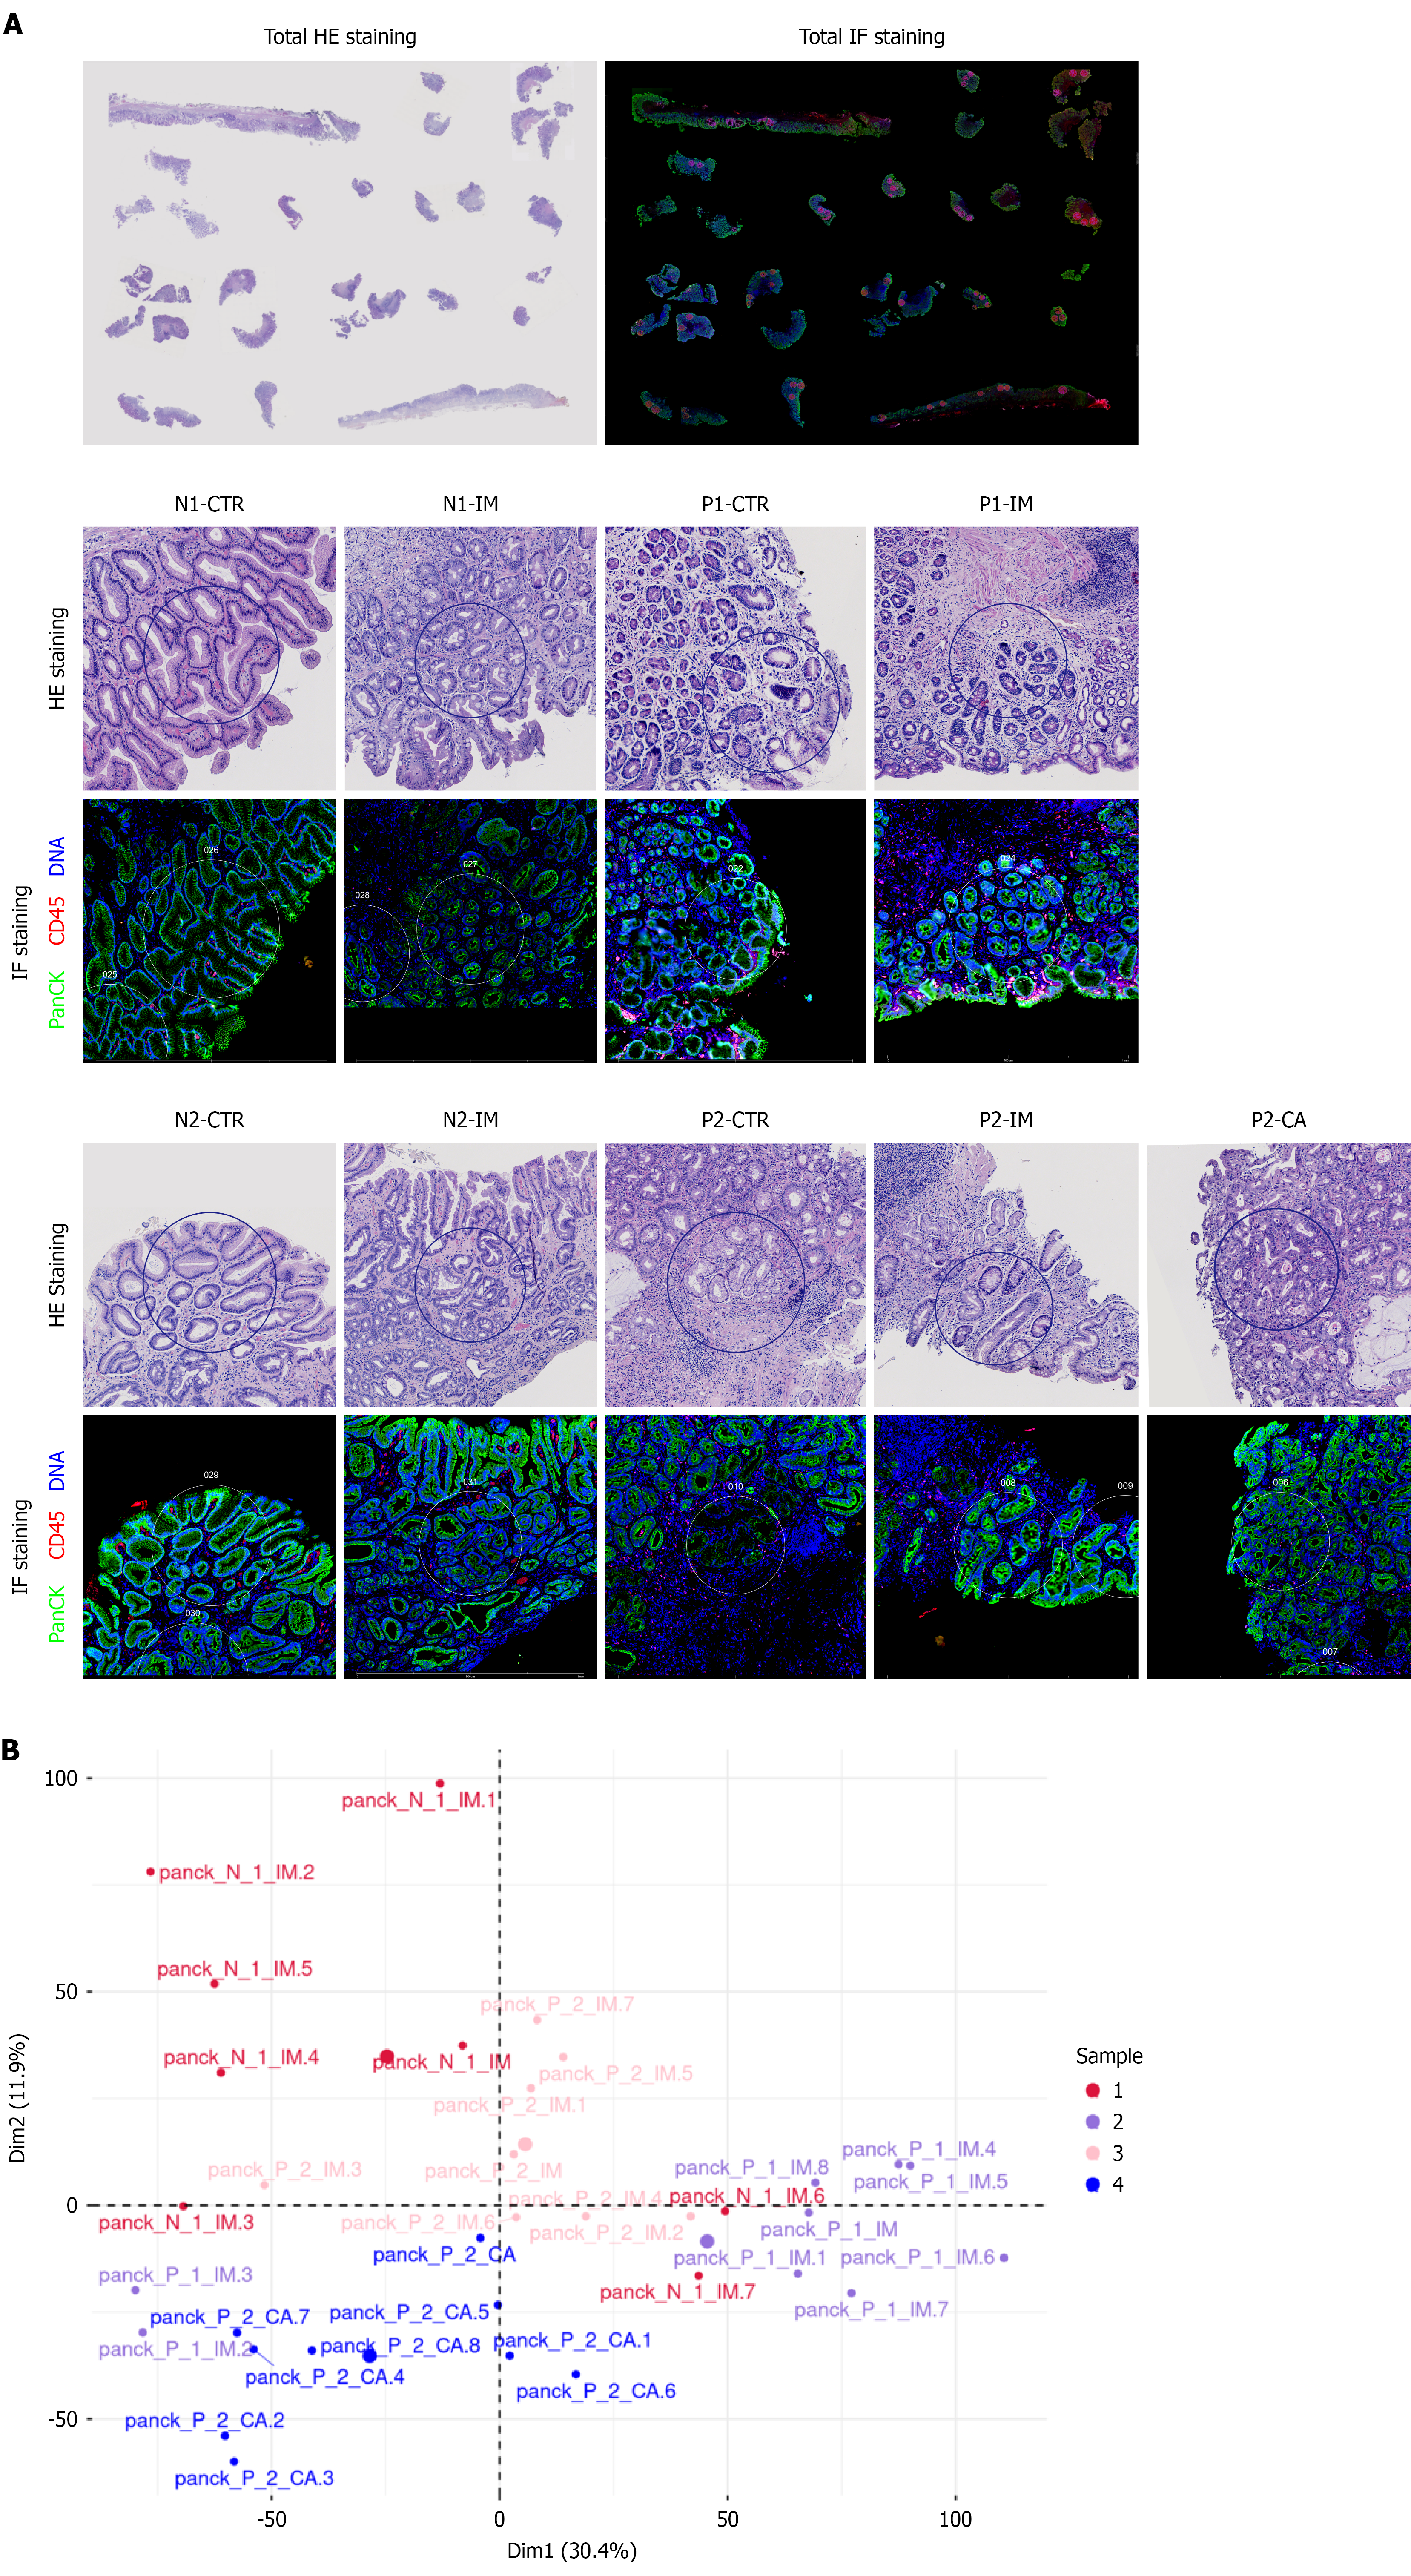
Figure 2 Digital spatial profiling of formalin-fixed, paraffin-embedded samples from gastric intestinal metaplasia patients.
A: Representative hematoxylin-eosin and immunofluorescence staining of regions of interest (ROIs); B: Principal component analysis for dimensionality reduction, visualizing all ROIs based on overall gene expression profiles, including the start of observation was defined as the time of the first gastroscopic biopsy [non-progression group (N)] N1-intestinal metaplasia (IM) (red color), progression group (P group) P1-IM (purple color), P2-IM (pink color), and P2-cancerous lesions (blue color). N group: Non-progression group; P group: Progression group; IF: Immunofluorescence; HE: Hematoxylin-eosin; PanCK: Pan-cytokeratin; CD: Cluster of differentiation; CTR: Containing normal tissue; IM: Intestinal metaplasia.
- Citation: He S, Guo XF, Wang Y, Bai JQ, Wang JP, Shi JH, Shi YY, Yuan J, Wei W, Yang Y, Shi XH, Feng Y, Ding X, Gao W, Lu D, Zhou WX, Zhang P. FOLH1 as a novel biomarker for risk stratification in gastric intestinal metaplasia. World J Gastroenterol 2026; 32(25): 118842
- URL: https://www.wjgnet.com/1007-9327/full/v32/i25/118842.htm
- DOI: https://dx.doi.org/10.3748/wjg.118842