
















Copyright: ©Author(s) 2026.
World J Gastroenterol. Jul 7, 2026; 32(25): 118597
Published online Jul 7, 2026. doi: 10.3748/wjg.118597
Published online Jul 7, 2026. doi: 10.3748/wjg.118597
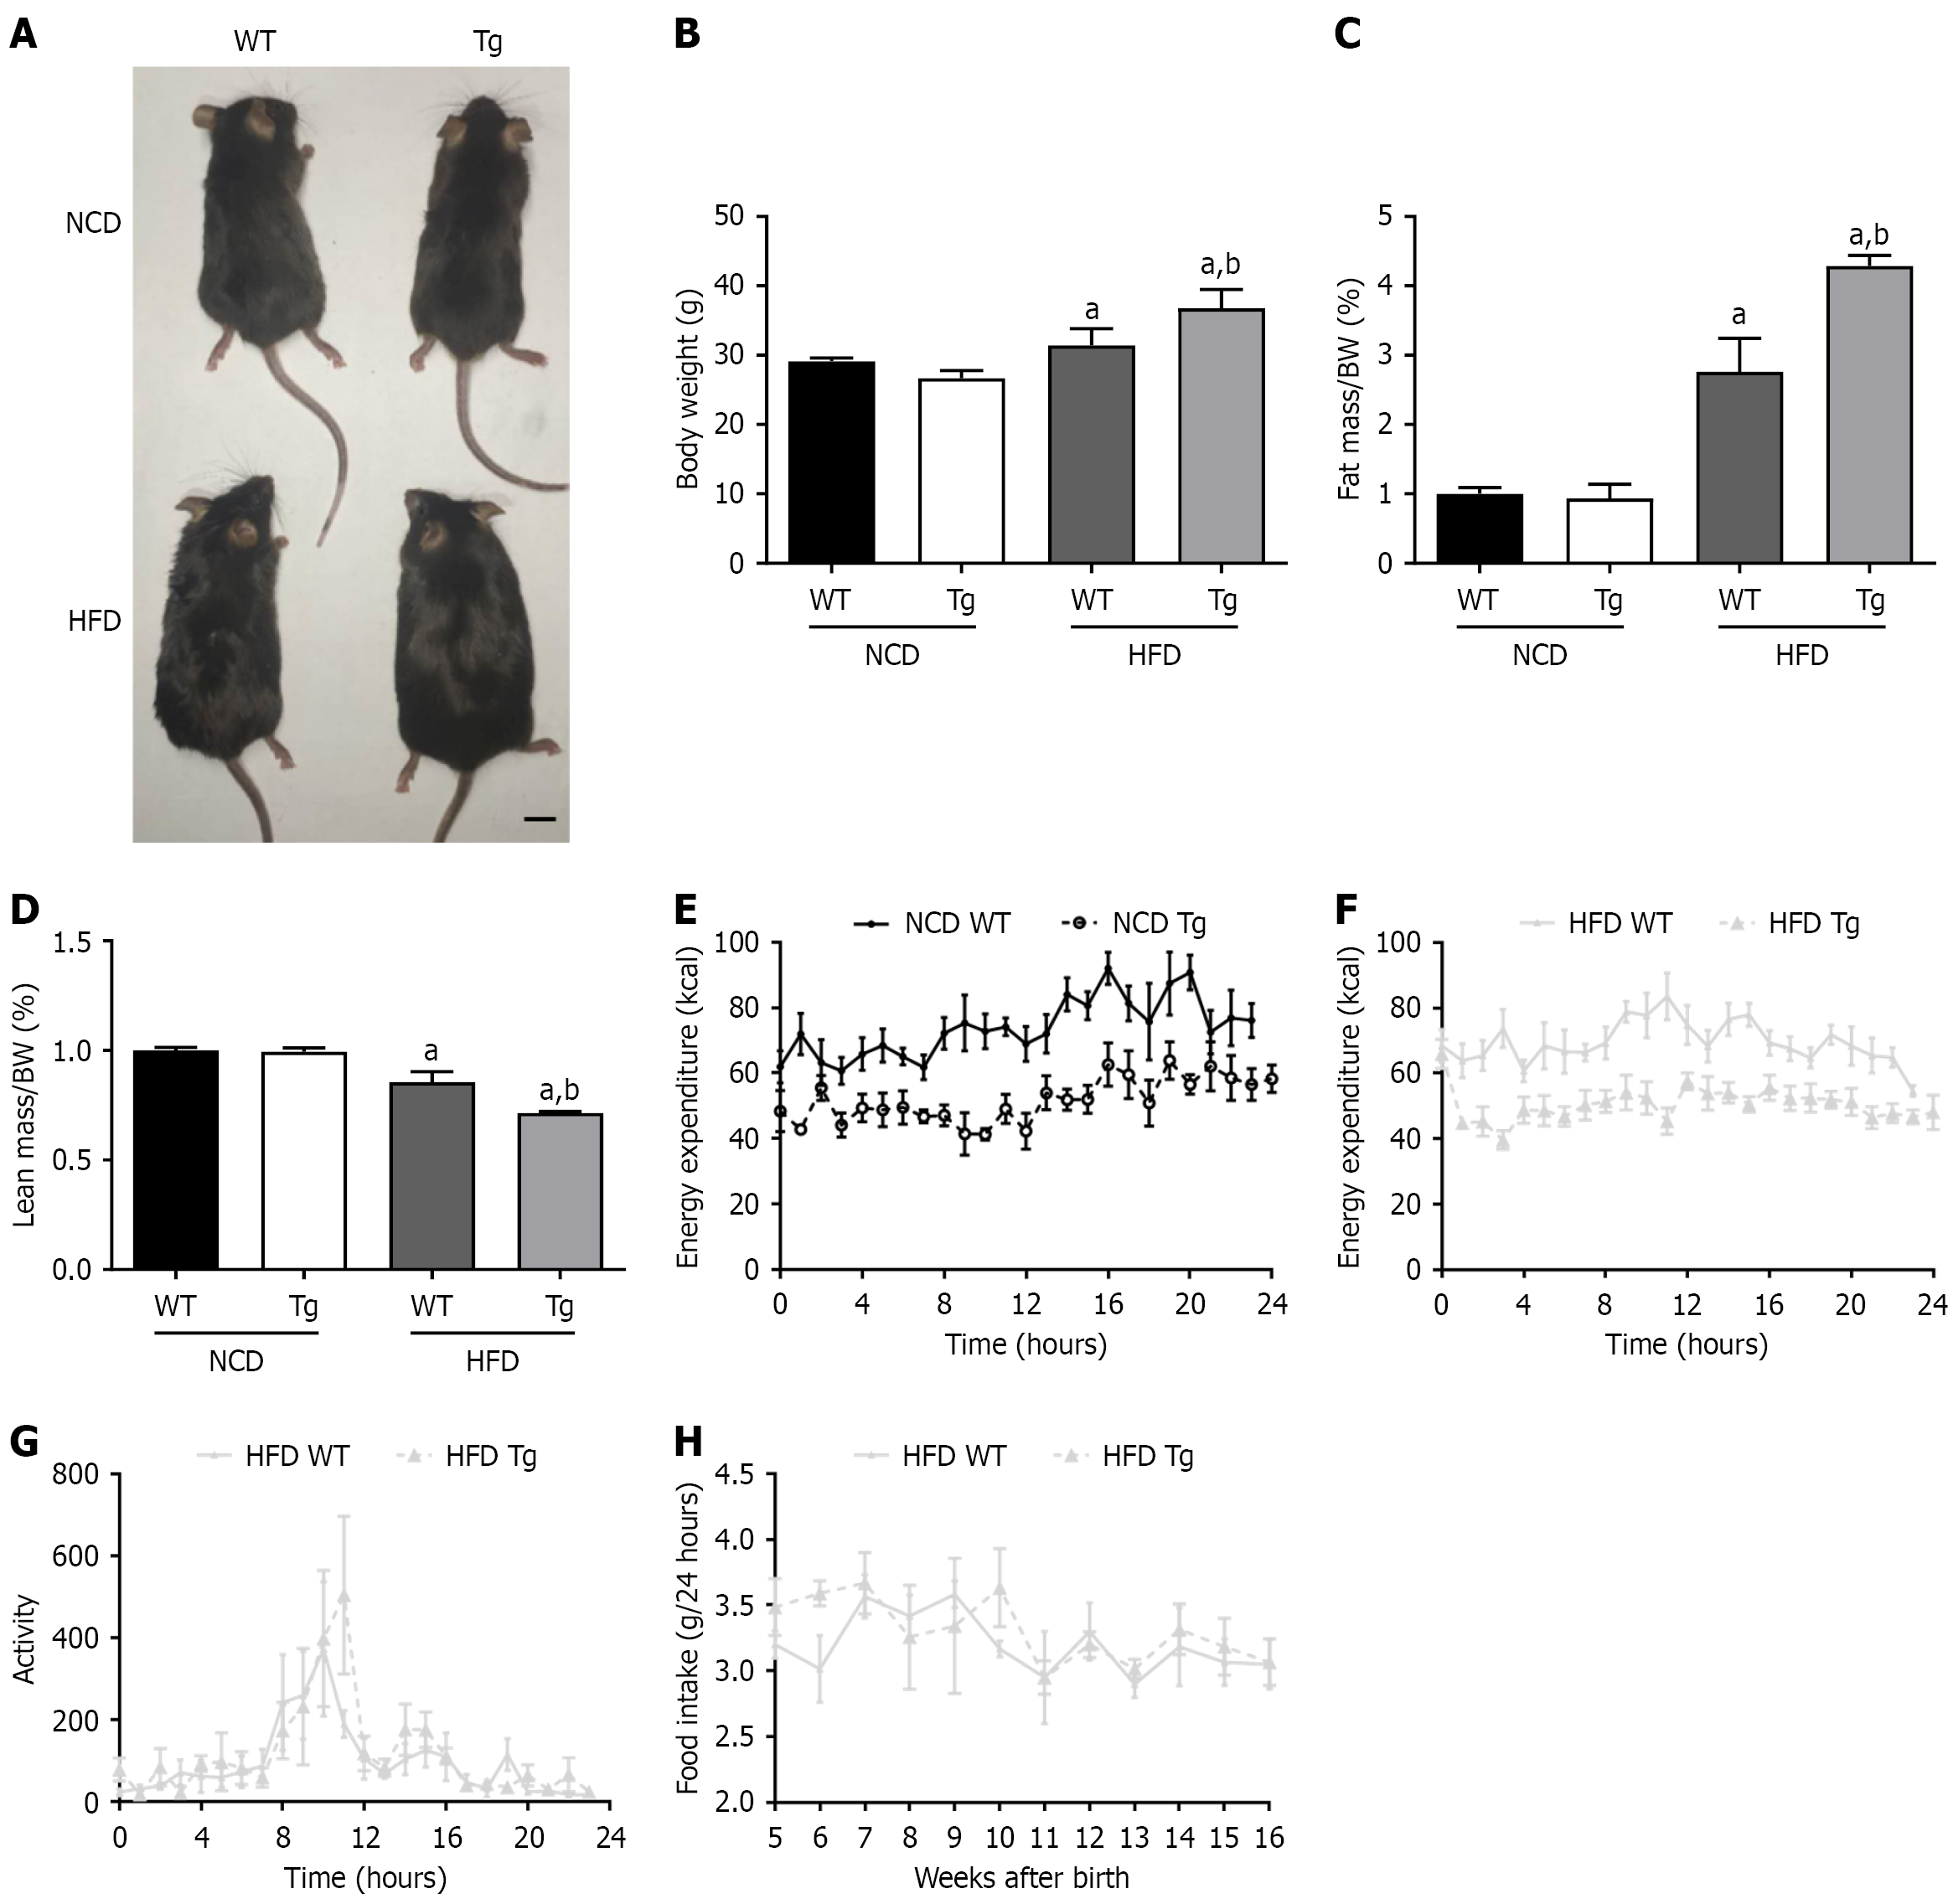
Figure 1 General indexes of S100A11-hTg mice.
All data are presented as mean ± SE. n = 6 mice/group. Statistical analysis was performed using one-way analysis of variance. P values were adjusted for multiple testing using the Bonferroni correction: aP < 0.05 vs normal-chow diet (NCD) wild type, bP < 0.05 vs high-fat (HFD) diet wild type. Five-week-old male S100A11-hTg mice and littermate control mice were fed NCD or HFD for 12 weeks. A: General picture of mice at 17 weeks of age, scale bar: 1 cm; B: Body weight of mice at 17 weeks of age; C: Fat mass as a percentage of body weight; D: Lean mass as a percentage of body weight; E: Energy consumption of mice under NCD; F: Energy consumption of mice under HFD; G: Activity of mice under HFD; H: Food intake of mice under HFD. NCD: Normal-chow diet; HFD: High-fat diet; WT: Wild type.
- Citation: Zhang QQ, Lu XQ, Shang BZ, Liu LC, Lu ET, Li HY, Xia MM, Jin YX, Zhang WZ, Zhang Y, Han JY, Li Y. Calcium-dependent signaling protein family member S100A11 promotes liver and adipose lipid accumulation through fibroblast growth factor 21. World J Gastroenterol 2026; 32(25): 118597
- URL: https://www.wjgnet.com/1007-9327/full/v32/i25/118597.htm
- DOI: https://dx.doi.org/10.3748/wjg.118597