
















Copyright: ©Author(s) 2026.
World J Gastroenterol. Jun 28, 2026; 32(24): 118757
Published online Jun 28, 2026. doi: 10.3748/wjg.118757
Published online Jun 28, 2026. doi: 10.3748/wjg.118757
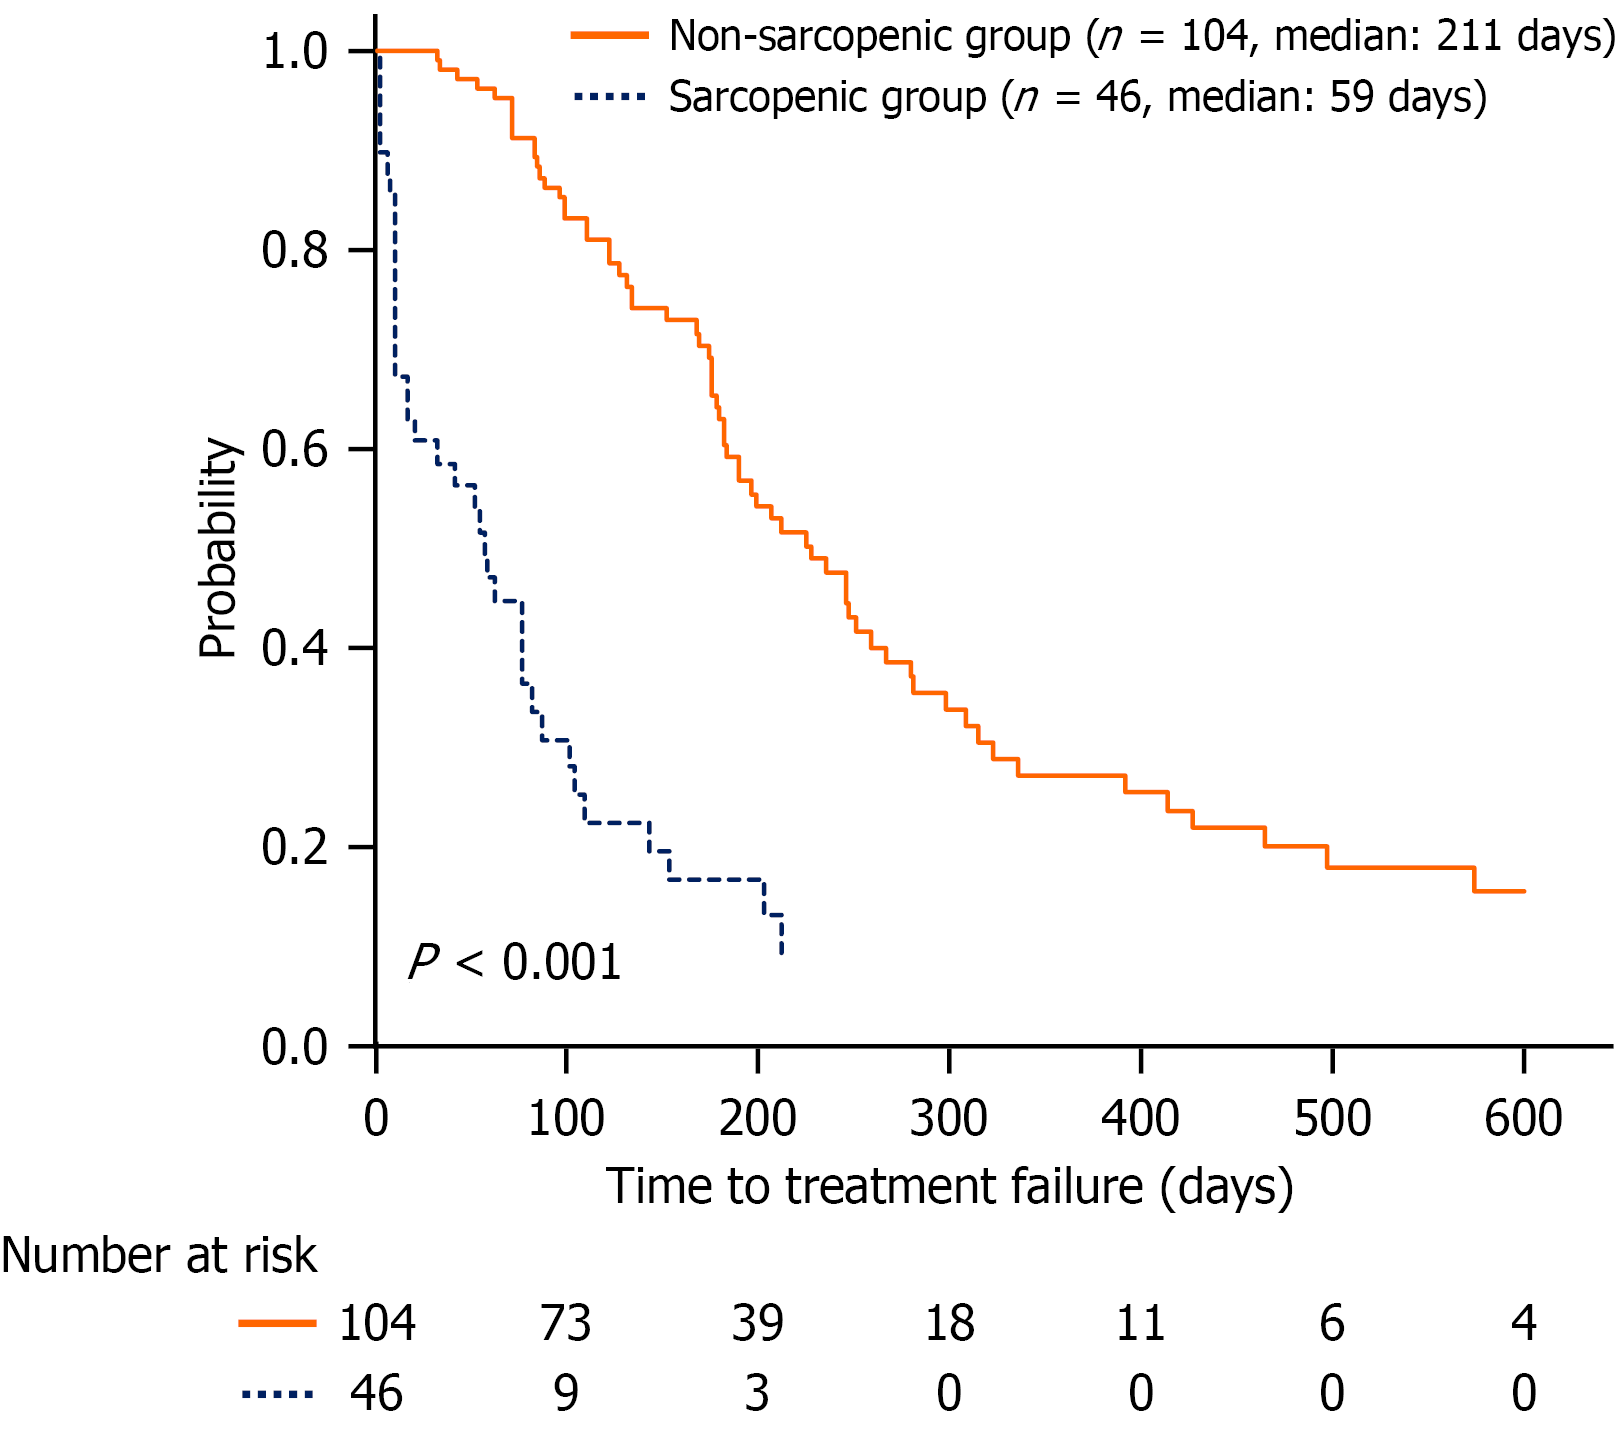
Figure 2 Kaplan-Meier curves for time to treatment failure in enrolled patients with and without sarcopenia.
The time to treatment failure of the sarcopenic group (dotted blue line) was significantly shorter than that of the non-sarcopenic group (solid orange line) (P < 0.001, log-rank test). The median time to treatment failure in the sarcopenic and non-sarcopenic groups were 59 and 211 days, respectively.
- Citation: Akazawa Y, Ohtani M, Murata Y, Tanaka T, Nosaka T, Takahashi K, Naito T, Nakamoto Y. Three-dimensional psoas muscle volume and longitudinal changes as predictors of outcomes in older patients with advanced pancreatic cancer. World J Gastroenterol 2026; 32(24): 118757
- URL: https://www.wjgnet.com/1007-9327/full/v32/i24/118757.htm
- DOI: https://dx.doi.org/10.3748/wjg.118757