
















Copyright: ©Author(s) 2026.
World J Gastroenterol. Jun 28, 2026; 32(24): 118757
Published online Jun 28, 2026. doi: 10.3748/wjg.118757
Published online Jun 28, 2026. doi: 10.3748/wjg.118757
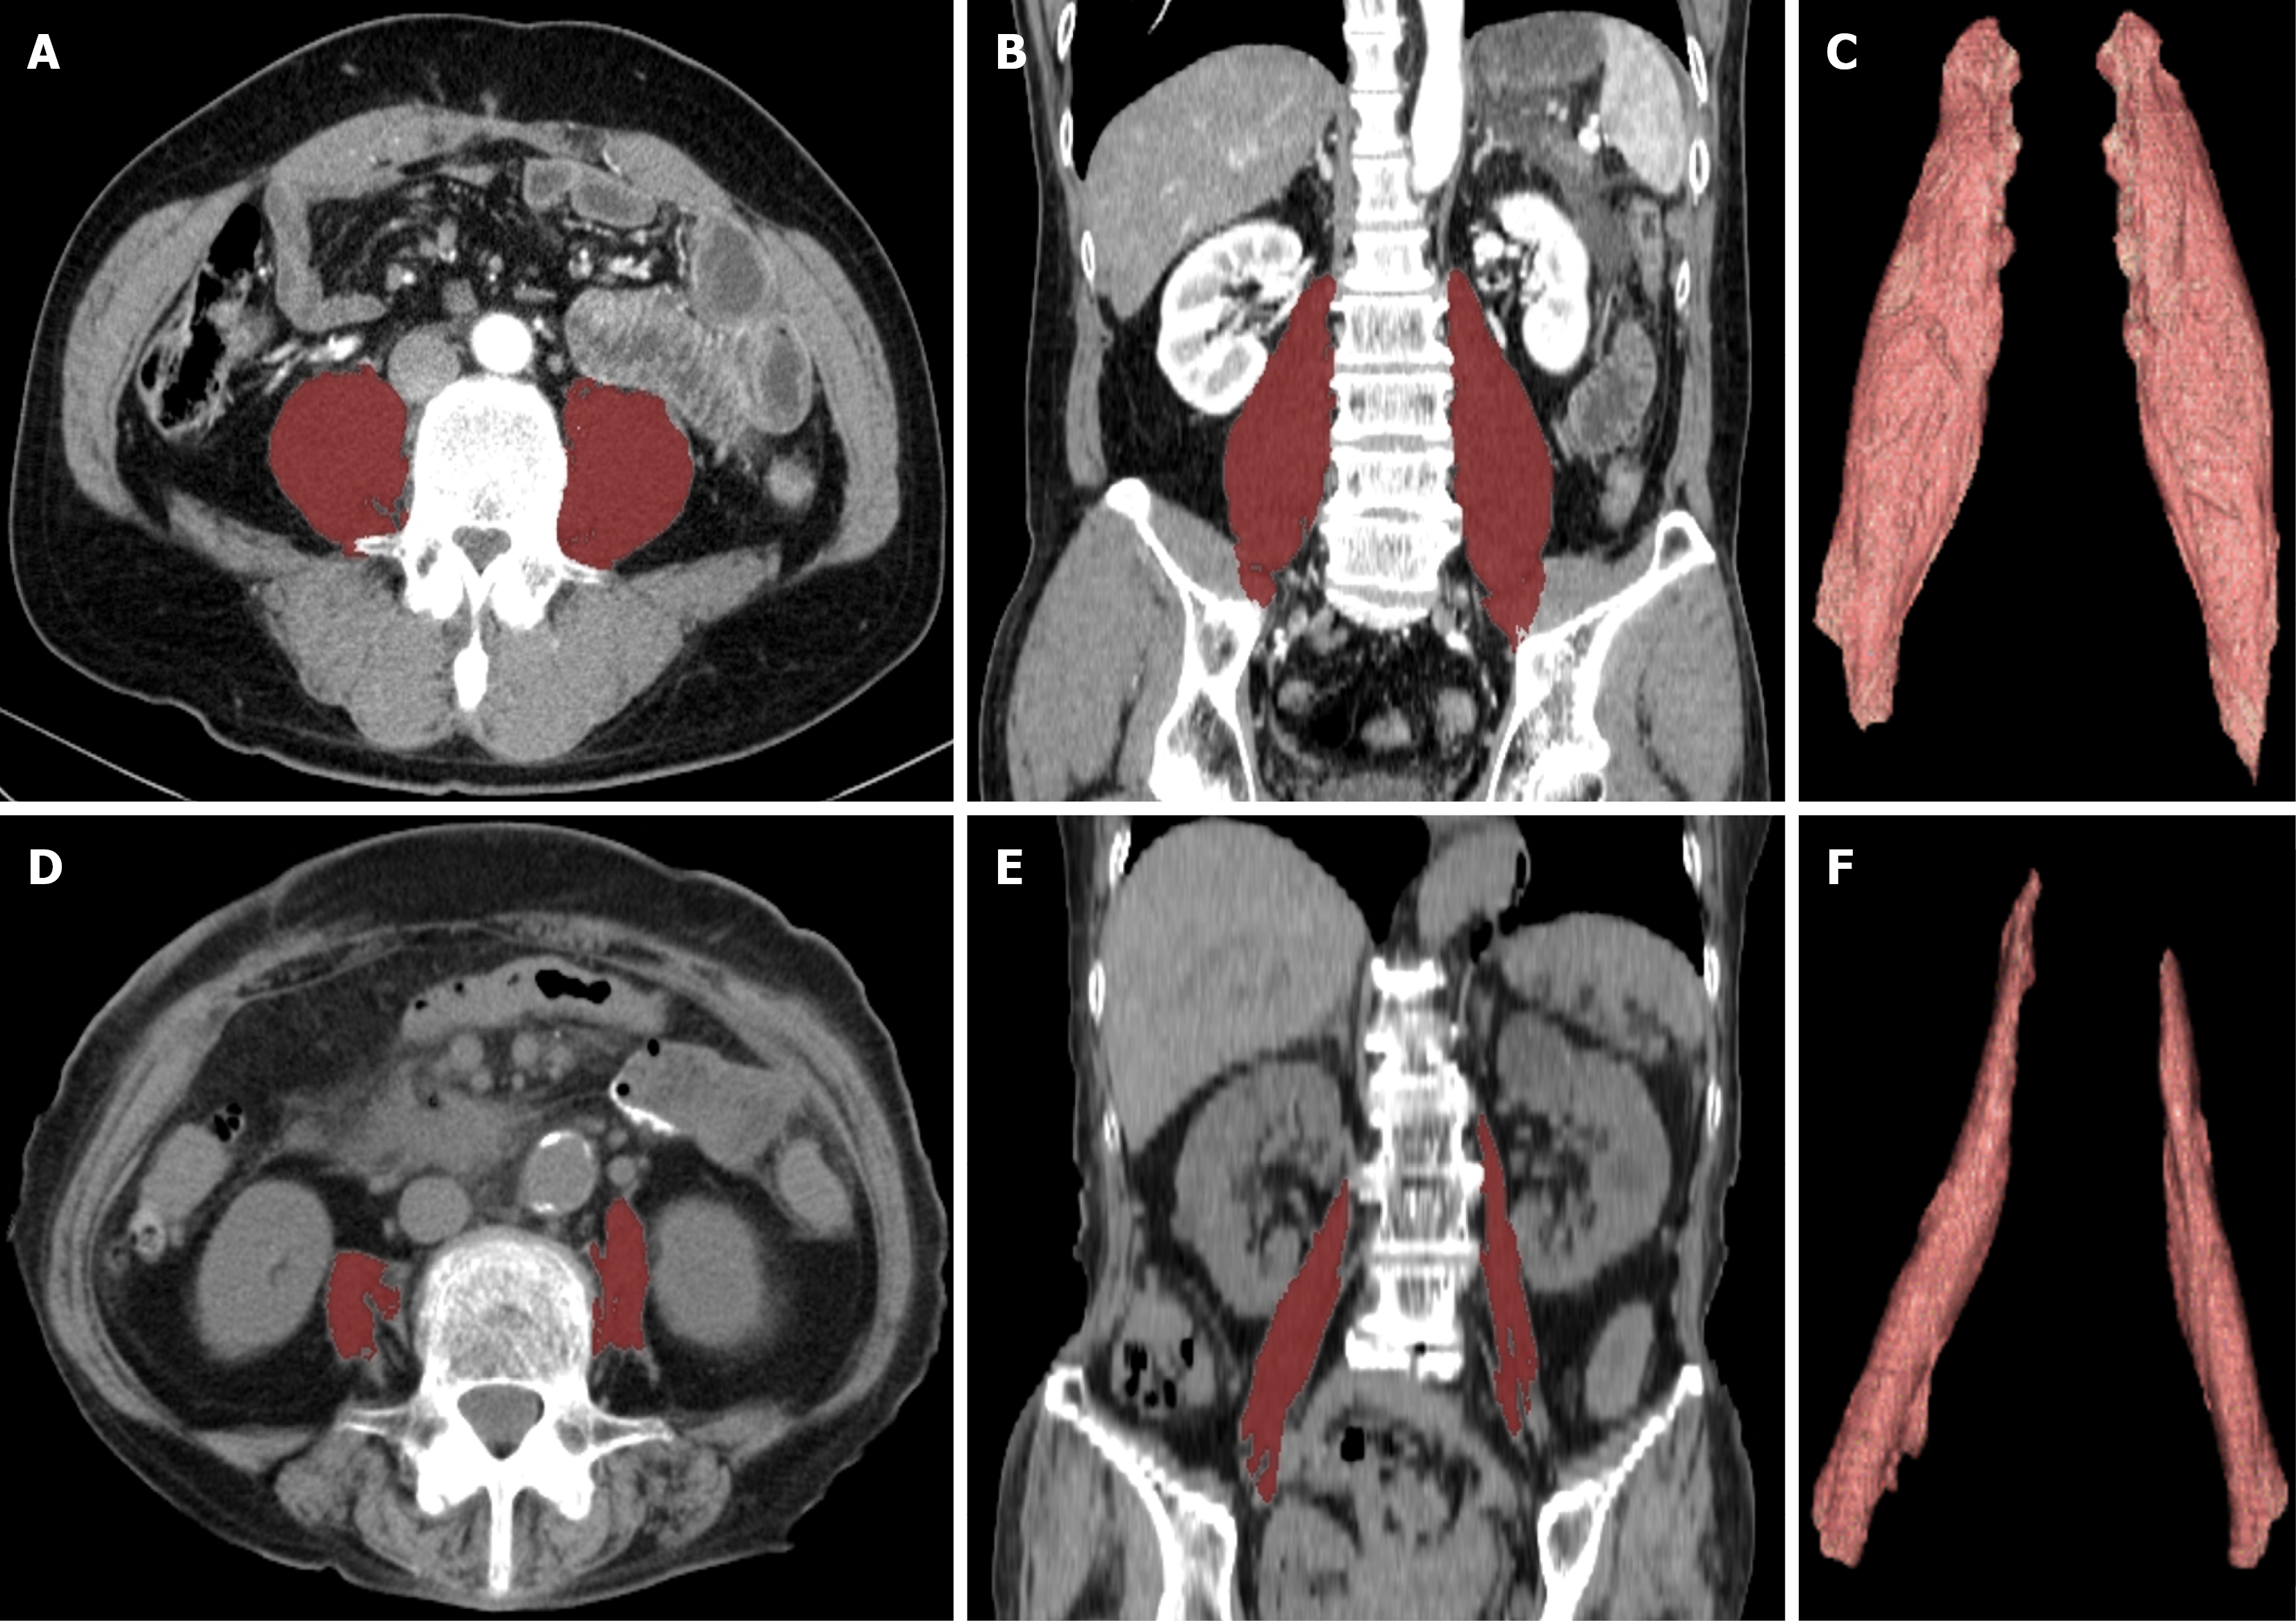
Figure 1 Psoas muscle mass analysis by three-dimensional imaging using pre-chemotherapy computed tomography in sarcopenic and non-sarcopenic patients.
A-C: In a representative non-sarcopenic patient, bilateral psoas muscle areas (red) at the third lumbar vertebra level on axial computed tomography (CT) (A) and at the maximum level on coronal CT (B), and bilateral psoas muscle volume extracted by semi-automatic image analysis (C); D-F: In a representative sarcopenic patient, bilateral psoas muscle areas (red) at the third lumbar vertebra level with axial CT image (D) and at the maximum level with coronal CT image (E), and bilateral psoas muscle volume extracted by semi-automatic image analysis (F).
- Citation: Akazawa Y, Ohtani M, Murata Y, Tanaka T, Nosaka T, Takahashi K, Naito T, Nakamoto Y. Three-dimensional psoas muscle volume and longitudinal changes as predictors of outcomes in older patients with advanced pancreatic cancer. World J Gastroenterol 2026; 32(24): 118757
- URL: https://www.wjgnet.com/1007-9327/full/v32/i24/118757.htm
- DOI: https://dx.doi.org/10.3748/wjg.118757