
















Copyright: ©Author(s) 2026.
World J Gastroenterol. Jun 28, 2026; 32(24): 117849
Published online Jun 28, 2026. doi: 10.3748/wjg.117849
Published online Jun 28, 2026. doi: 10.3748/wjg.117849
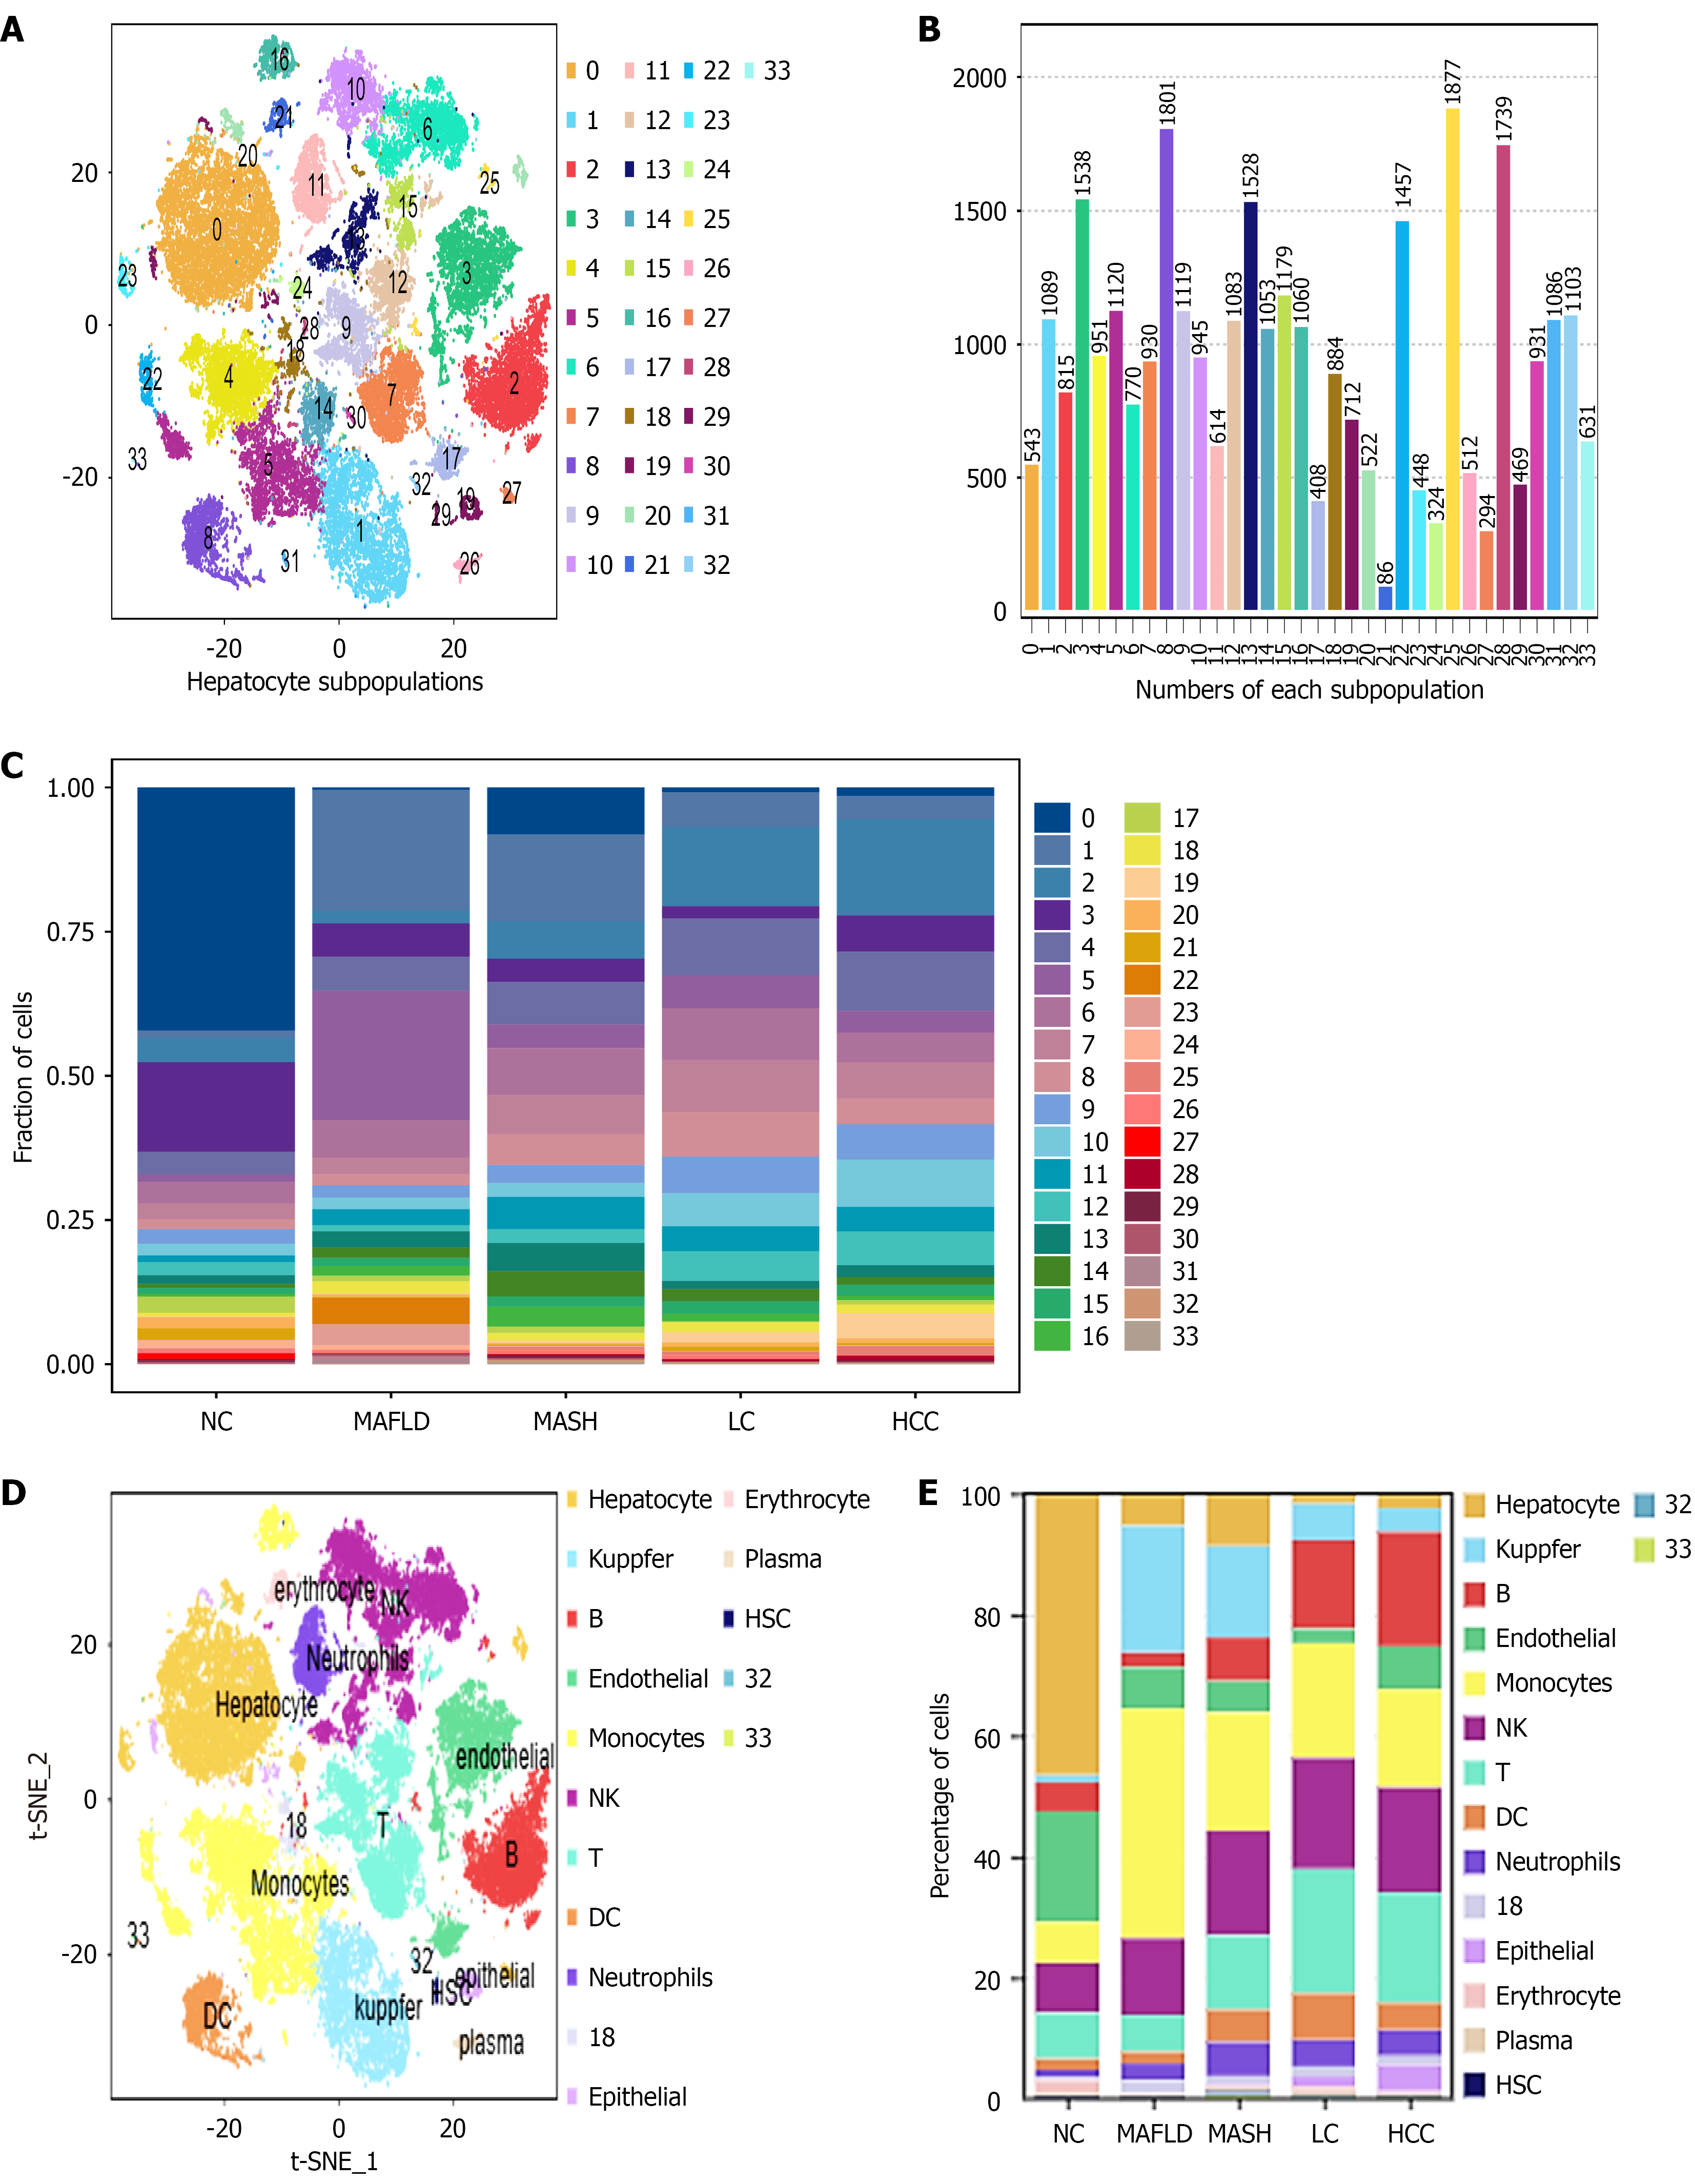
Figure 4 Hepatic cell clustering under lipid aggregation.
A: Cell clustering of hepatic cells in healthy liver; B: Number of hepatic cell in each subpopulation; C: Dynamic liver cell subpopulations during metabolic dysfunction-associated fatty liver disease malignancy. Identifiable cells: Hepatocytes (0, 20, 23, 24, 27); B cells (2, 25, 28); endothelial cells (3, 17); natural killer cells (6, 10, 13); T cells/monocytes/macrophages (7, 9, 2, 15); dendritic cells (8); neutrophils (11); bile duct cells (19); red blood cells (21); plasma cells (26); hepatic stellate cells (29); dendritic cells (33). Unidentified cells (1, 4, 5, 14, 16, 18, 22, 30, 31, 32); D: The 16 most abundant subpopulations of immune cells in the healthy liver: Hepatocytes (0); macrophages (1, 4, 5, 14, 16); B cells (2); endothelial cells (3); natural killer cells (6, 10, 13); T cells/monocytes (7, 9, 12, 15); dendritic cells (8); and neutrophils (11); E: The percentage of immune/inflammatory cells during metabolic dysfunction-associated fatty liver disease malignancy progression. NC: Normal control; MAFLD: Metabolic dysfunction-associated fatty liver disease; MASH: Metabolic dysfunction-associated steatohepatitis; LC: Liver cirrhosis; HCC: Hepatocellular carcinoma; NK: Natural killer; DC: Dendritic cell; HSC: Hepatic stellate cell.
- Citation: Yang J, Sai WL, Xia XX, Tang H, Xu M, Xie Q, Yao DF, Yao M. Differential metabolites facilitate metabolic dysfunction-associated fatty liver disease malignancy via immune evasion and M2-polarized macrophages. World J Gastroenterol 2026; 32(24): 117849
- URL: https://www.wjgnet.com/1007-9327/full/v32/i24/117849.htm
- DOI: https://dx.doi.org/10.3748/wjg.117849