
















Copyright: ©Author(s) 2026.
World J Gastroenterol. Jun 28, 2026; 32(24): 117849
Published online Jun 28, 2026. doi: 10.3748/wjg.117849
Published online Jun 28, 2026. doi: 10.3748/wjg.117849
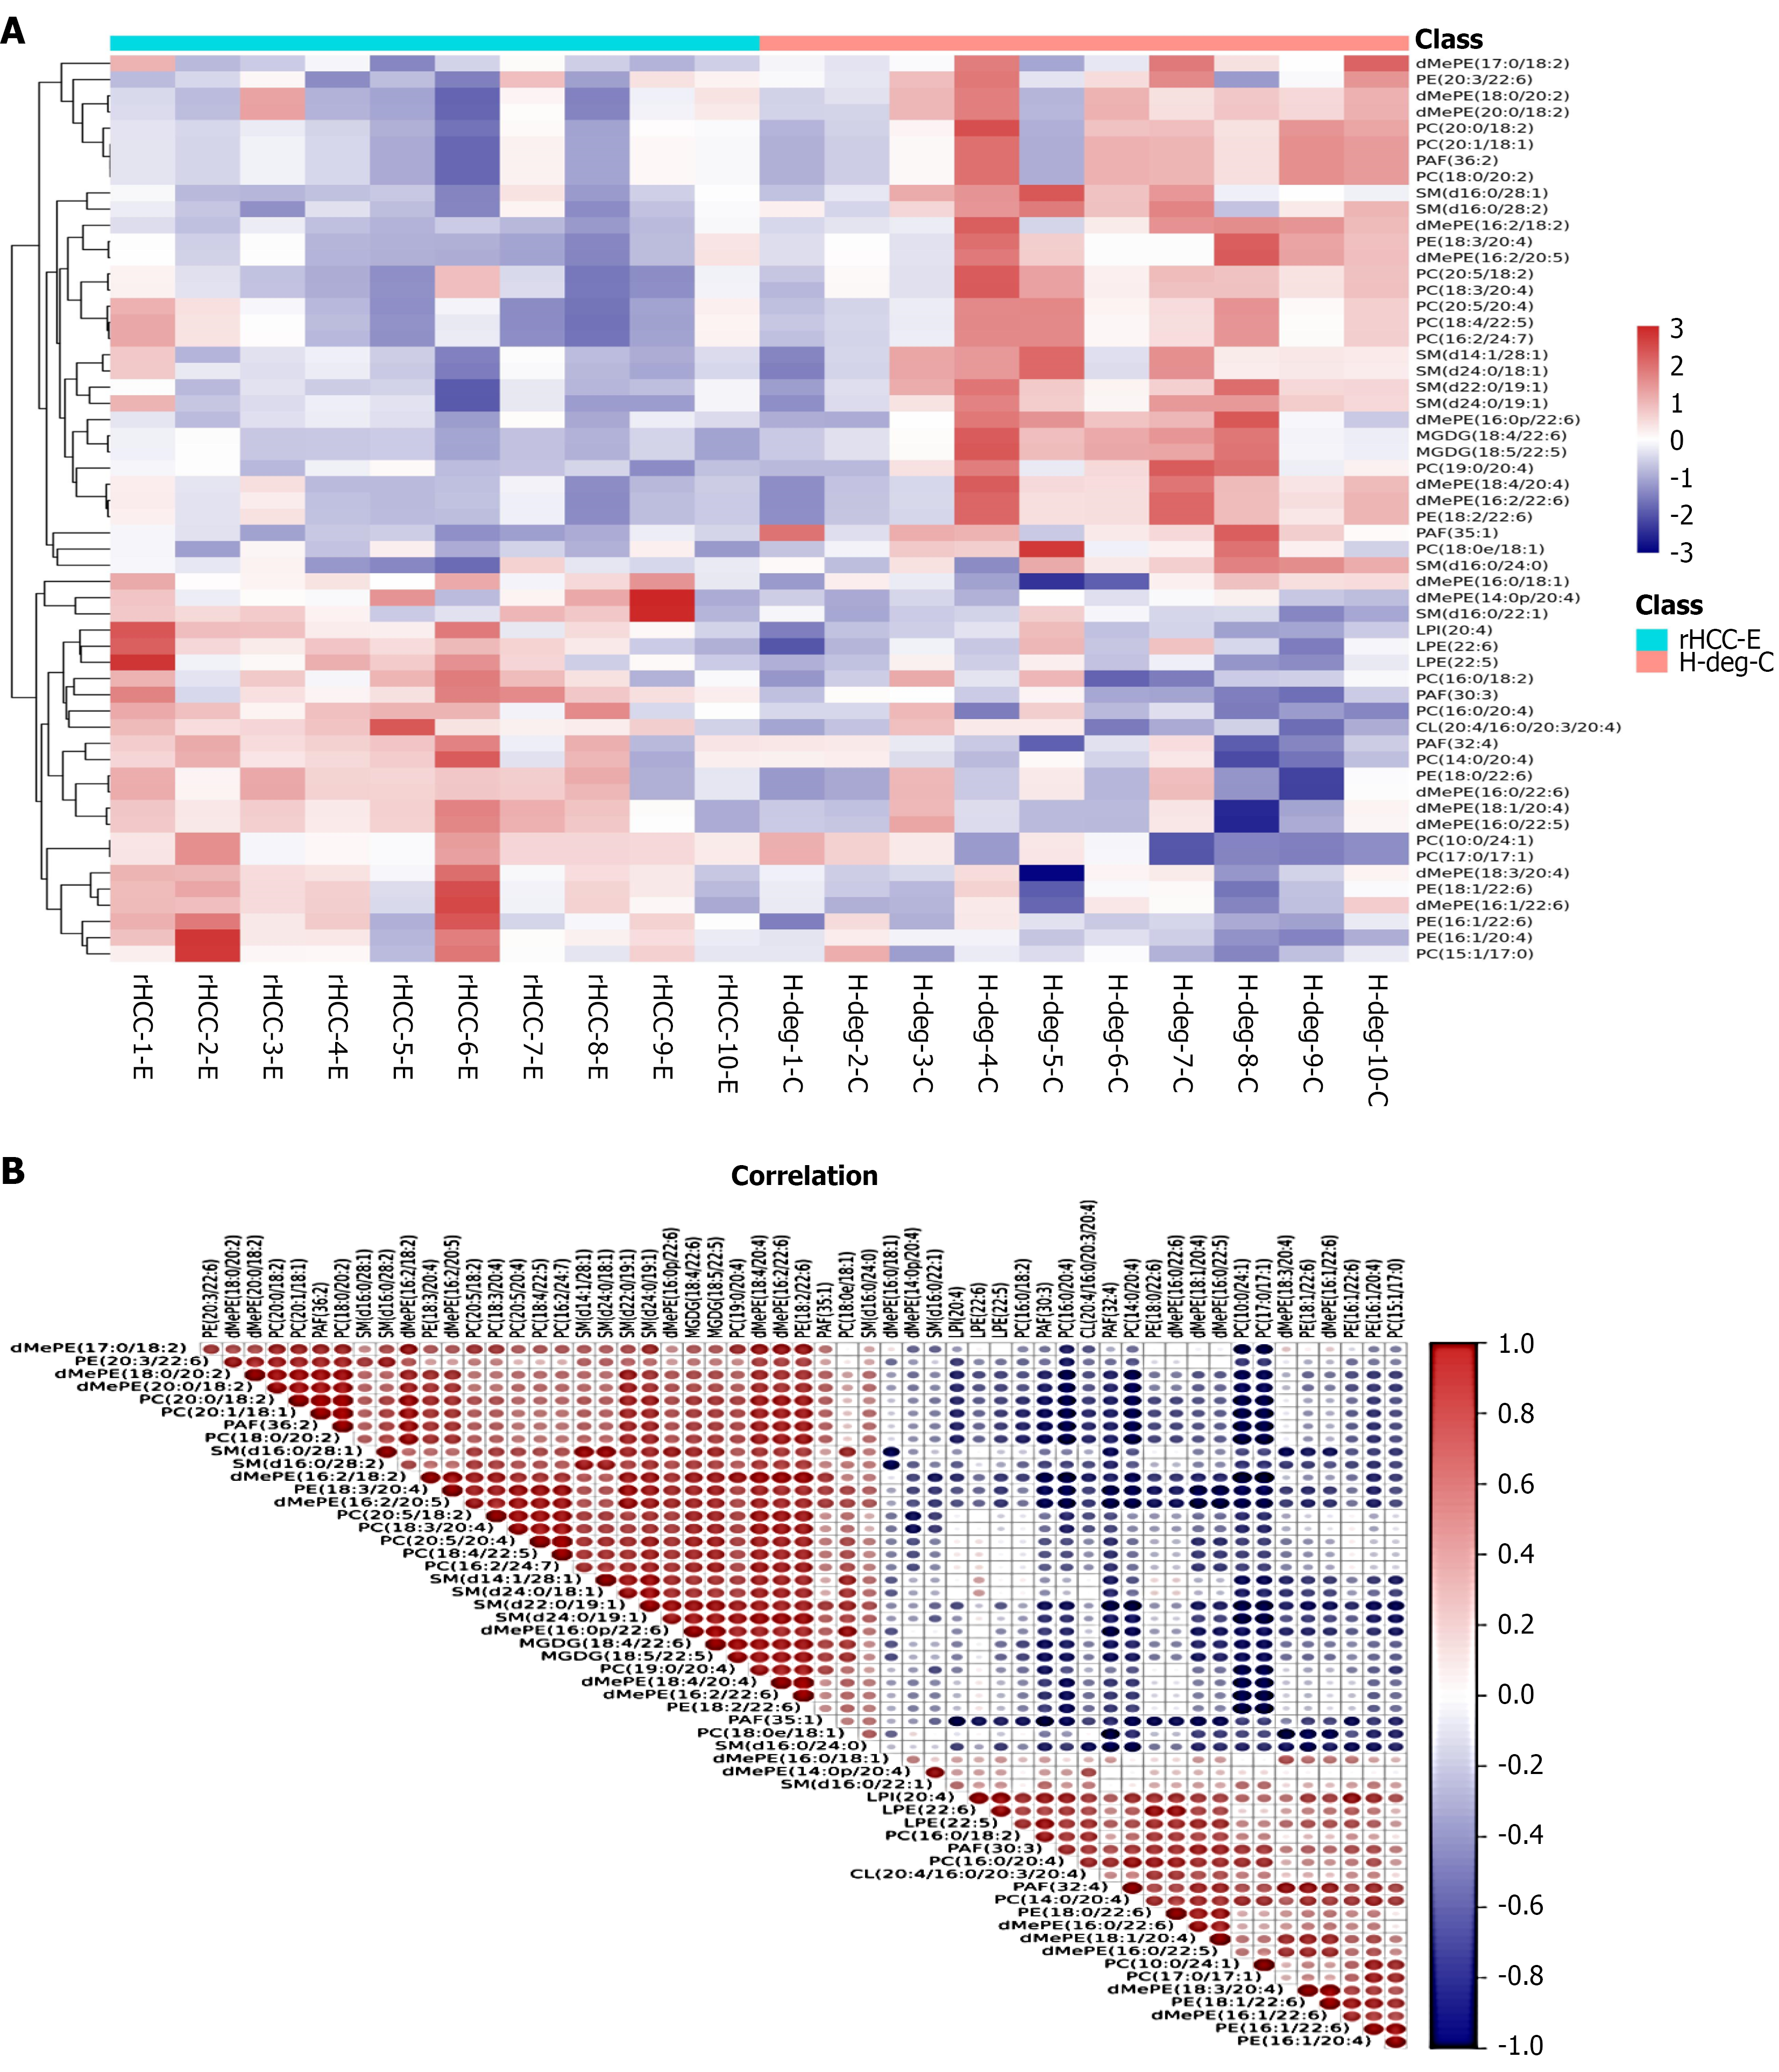
Figure 3 Correlation analysis of differential metabolites during metabolic dysfunction-associated fatty liver disease malignancy.
A: Hierarchical clustering of differential metabolites significantly different between the hepatocellular carcinoma (n = 10) and metabolic dysfunction-associated steatohepatitis (n = 10) groups. Horizontal, samples; vertical, differential metabolite (DM). Blue, low-abundance DM; red, high-abundance DM; B: Differential metabolites (hepatocellular carcinoma vs metabolic dysfunction-associated steatohepatitis) were analyzed with Pearson’s correlation coefficient. Blue, negative correlation; red, positive correlation. rHCC: Rat hepatocellular carcinoma; H-deg: Hepatocyte degeneration.
- Citation: Yang J, Sai WL, Xia XX, Tang H, Xu M, Xie Q, Yao DF, Yao M. Differential metabolites facilitate metabolic dysfunction-associated fatty liver disease malignancy via immune evasion and M2-polarized macrophages. World J Gastroenterol 2026; 32(24): 117849
- URL: https://www.wjgnet.com/1007-9327/full/v32/i24/117849.htm
- DOI: https://dx.doi.org/10.3748/wjg.117849