
















Copyright: ©Author(s) 2026.
World J Gastroenterol. Jun 21, 2026; 32(23): 118142
Published online Jun 21, 2026. doi: 10.3748/wjg.v32.i23.118142
Published online Jun 21, 2026. doi: 10.3748/wjg.v32.i23.118142
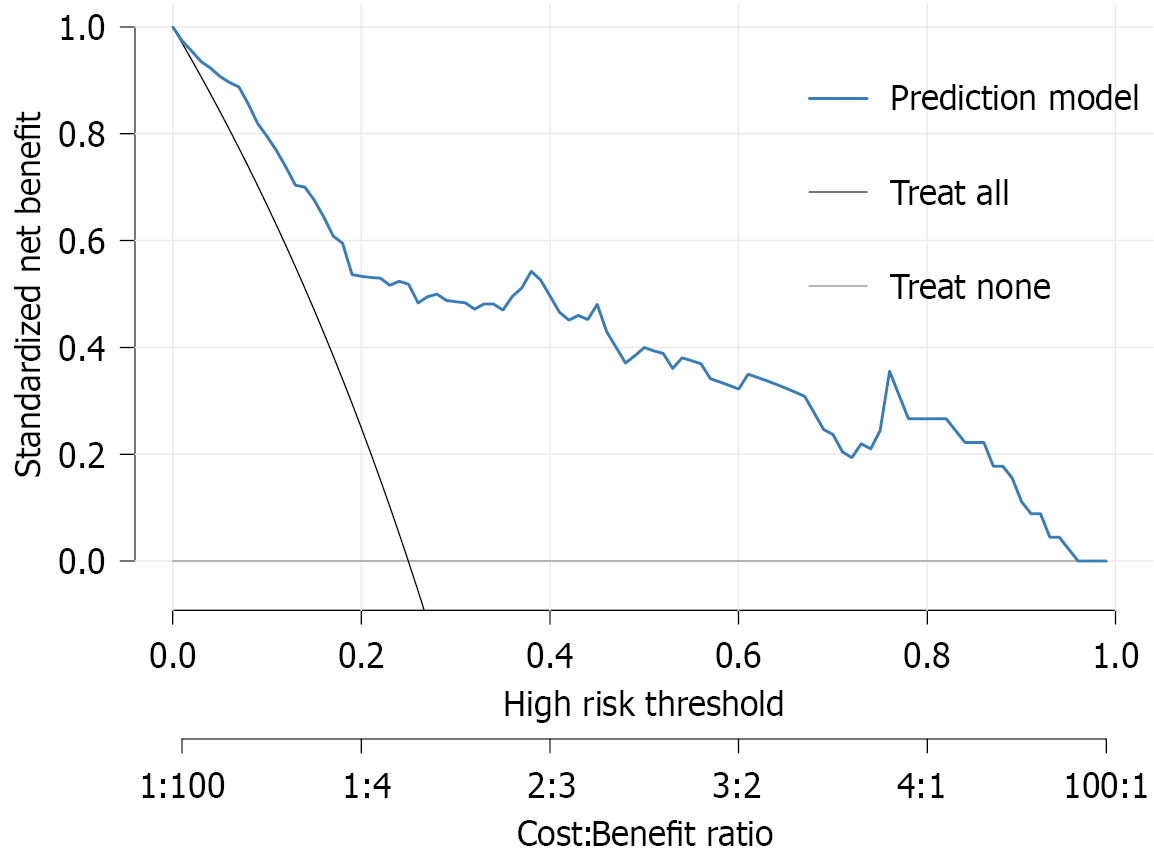
Figure 6 The blue curve represents the net benefit of the prediction model incorporating platelet count, spleen length, spleen width, splenic vein diameter, and portal pressure gradient.
The grey and black lines correspond to the “treat all” and “treat none” strategies, respectively. Across a wide range of high-risk thresholds, the model demonstrates a consistently greater standardized net benefit compared with the two default strategies, indicating its potential clinical utility in guiding individualized risk-based decision-making.
- Citation: Ren YT, Wen JY, Tu JJ, Zhang H, Ding CF, Xiao JQ, Zhuge YZ. Development and validation of a nomogram predicting rebleeding in cirrhotic patients with patent transjugular intrahepatic portosystemic shunt. World J Gastroenterol 2026; 32(23): 118142
- URL: https://www.wjgnet.com/1007-9327/full/v32/i23/118142.htm
- DOI: https://dx.doi.org/10.3748/wjg.v32.i23.118142