
















Copyright: ©Author(s) 2026.
World J Gastroenterol. Jun 21, 2026; 32(23): 118142
Published online Jun 21, 2026. doi: 10.3748/wjg.v32.i23.118142
Published online Jun 21, 2026. doi: 10.3748/wjg.v32.i23.118142
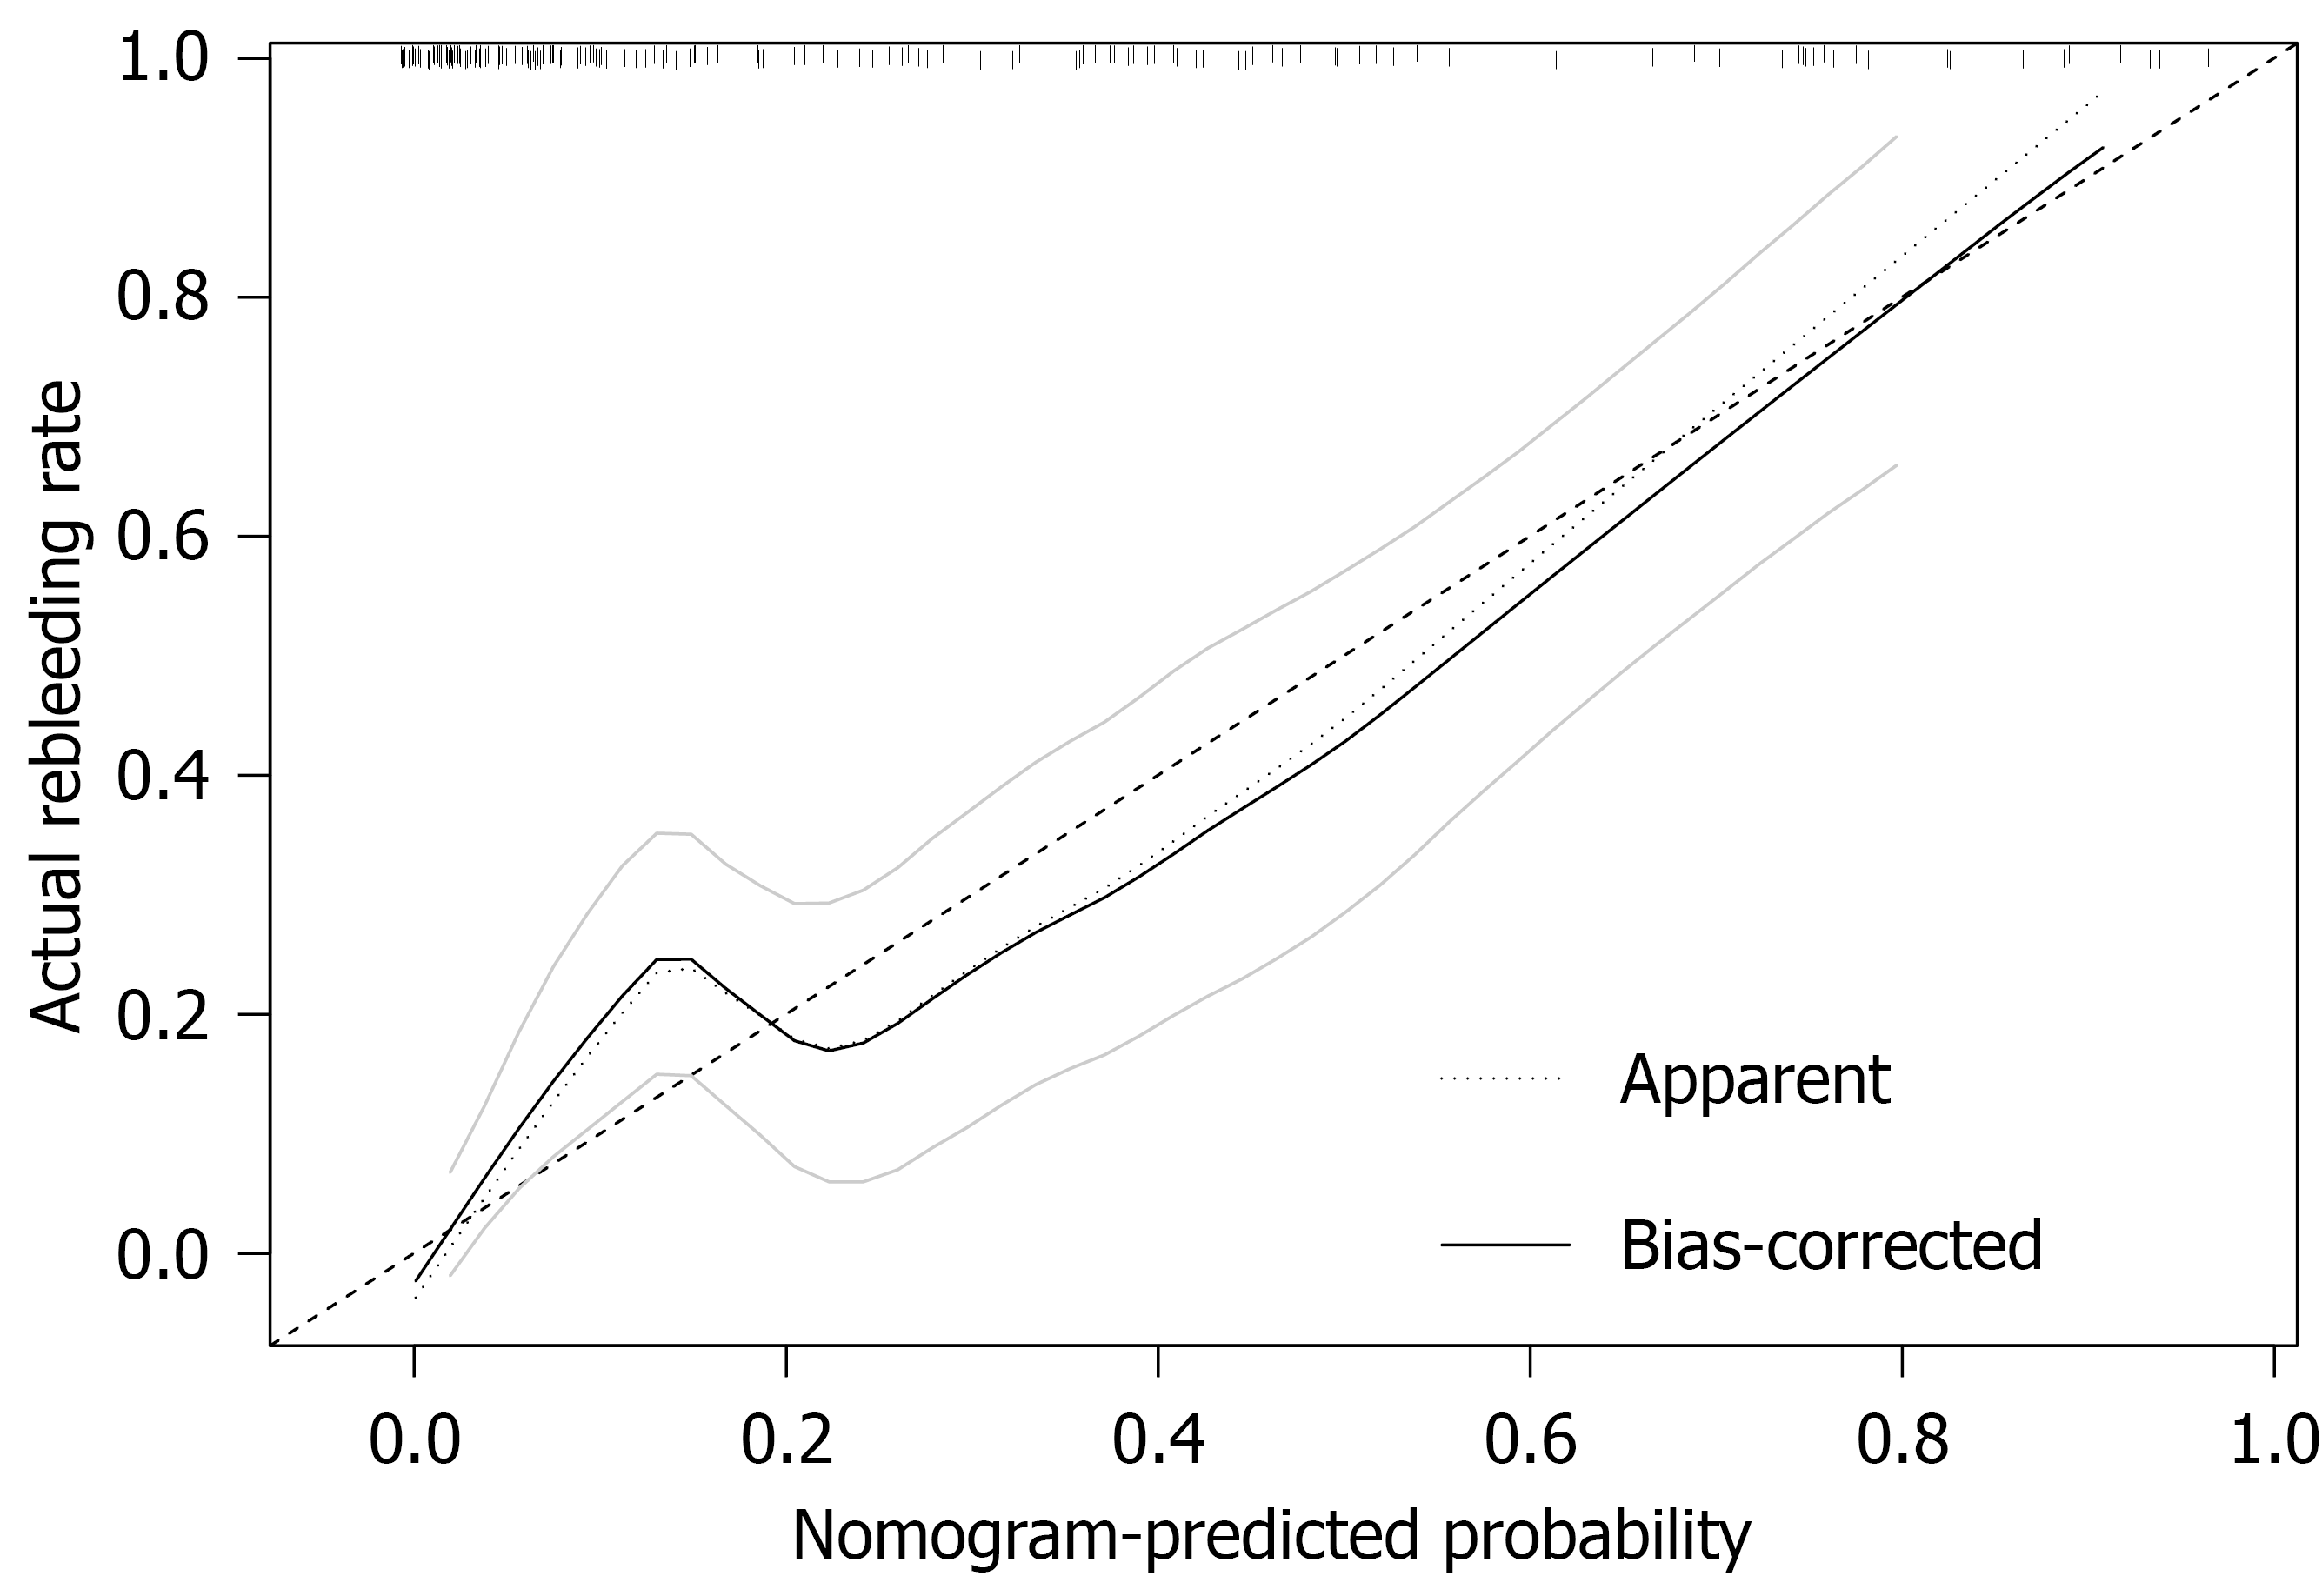
Figure 4 Calibration plot of the nomogram model.
This figure illustrates the agreement between the nomogram-predicted probability of rebleeding and the actual observed rebleeding rate. The dotted line (apparent) represents the model’s performance on the original dataset, while the solid line (bias-corrected) shows the boot-strap-corrected calibration curve based on 1000 resamples, indicating the model’s internal stability. The diagonal line denotes perfect calibration. The mean absolute error was 0.046 (n = 180), demonstrating good concordance between predicted and observed outcomes.
- Citation: Ren YT, Wen JY, Tu JJ, Zhang H, Ding CF, Xiao JQ, Zhuge YZ. Development and validation of a nomogram predicting rebleeding in cirrhotic patients with patent transjugular intrahepatic portosystemic shunt. World J Gastroenterol 2026; 32(23): 118142
- URL: https://www.wjgnet.com/1007-9327/full/v32/i23/118142.htm
- DOI: https://dx.doi.org/10.3748/wjg.v32.i23.118142