
















Copyright: ©Author(s) 2026.
World J Gastroenterol. Jun 21, 2026; 32(23): 118142
Published online Jun 21, 2026. doi: 10.3748/wjg.v32.i23.118142
Published online Jun 21, 2026. doi: 10.3748/wjg.v32.i23.118142
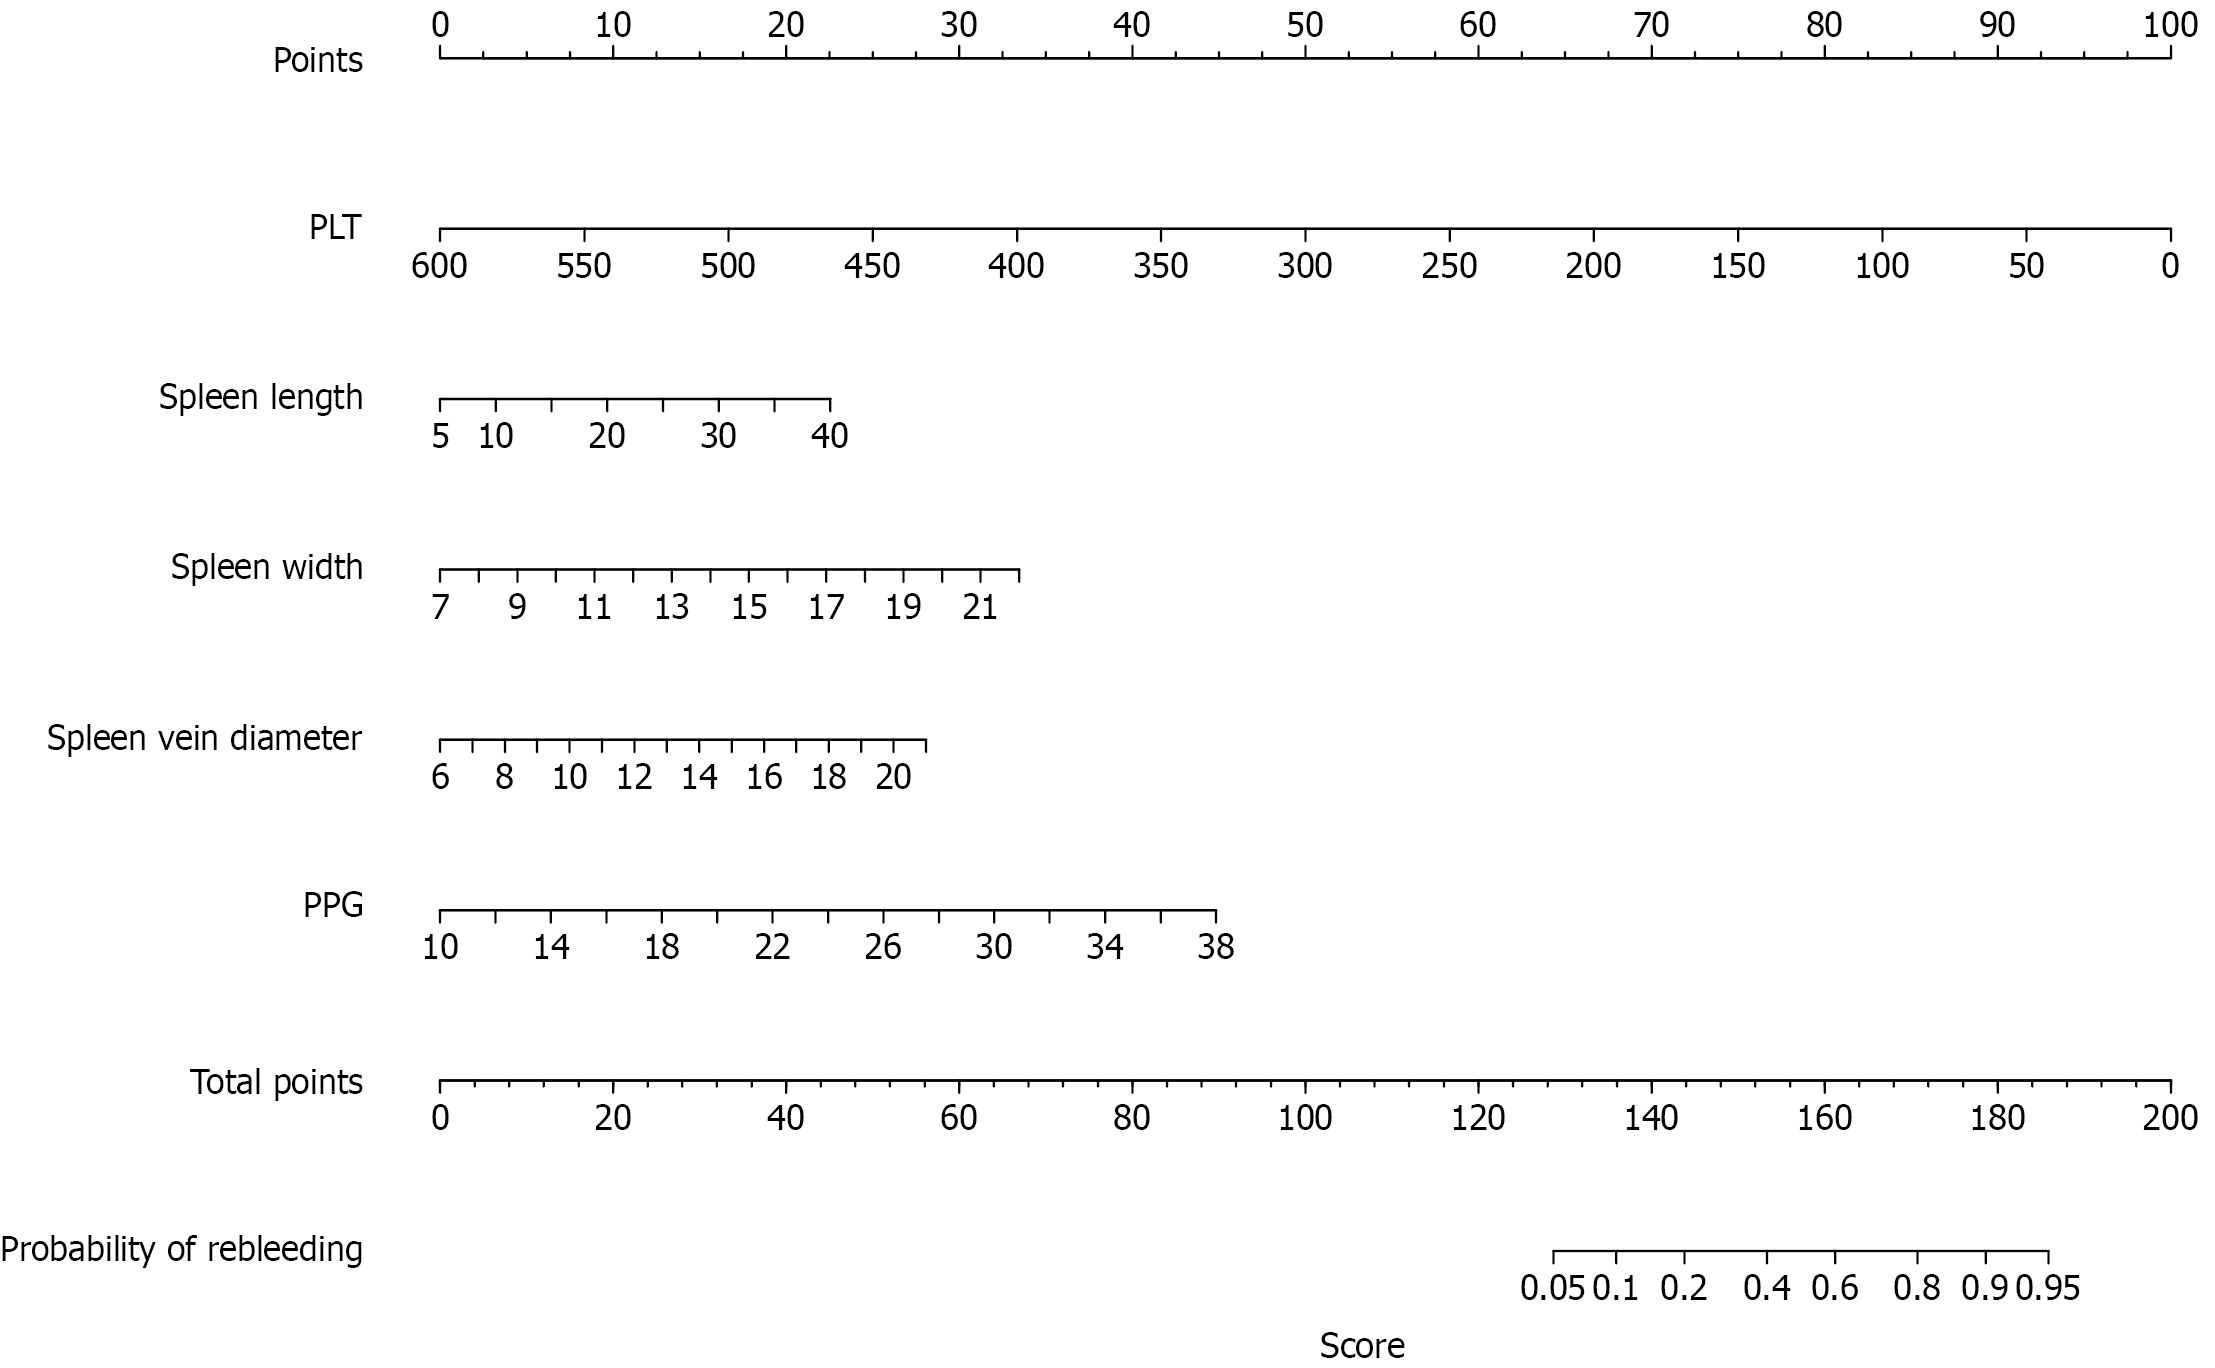
Figure 3 Nomogram for predicting the probability of rebleeding.
This nomogram integrates five predictors platelet count, spleen length, spleen width, splenic vein diameter, and portal pressure gradient to estimate the individual risk of rebleeding. For each predictor, the corresponding patient value is located on its respective axis and converted to points using the “points” scale at the top. The sum of all points yields the “total points”, which maps to the predicted probability of re-bleeding shown on the bottom scale. This model provides a quantitative tool to sup-port clinical risk assessment. PLT: Platelet; PPG: Portacaval pressure gradient.
- Citation: Ren YT, Wen JY, Tu JJ, Zhang H, Ding CF, Xiao JQ, Zhuge YZ. Development and validation of a nomogram predicting rebleeding in cirrhotic patients with patent transjugular intrahepatic portosystemic shunt. World J Gastroenterol 2026; 32(23): 118142
- URL: https://www.wjgnet.com/1007-9327/full/v32/i23/118142.htm
- DOI: https://dx.doi.org/10.3748/wjg.v32.i23.118142