
















Copyright: ©Author(s) 2026.
World J Gastroenterol. Jun 21, 2026; 32(23): 117320
Published online Jun 21, 2026. doi: 10.3748/wjg.v32.i23.117320
Published online Jun 21, 2026. doi: 10.3748/wjg.v32.i23.117320
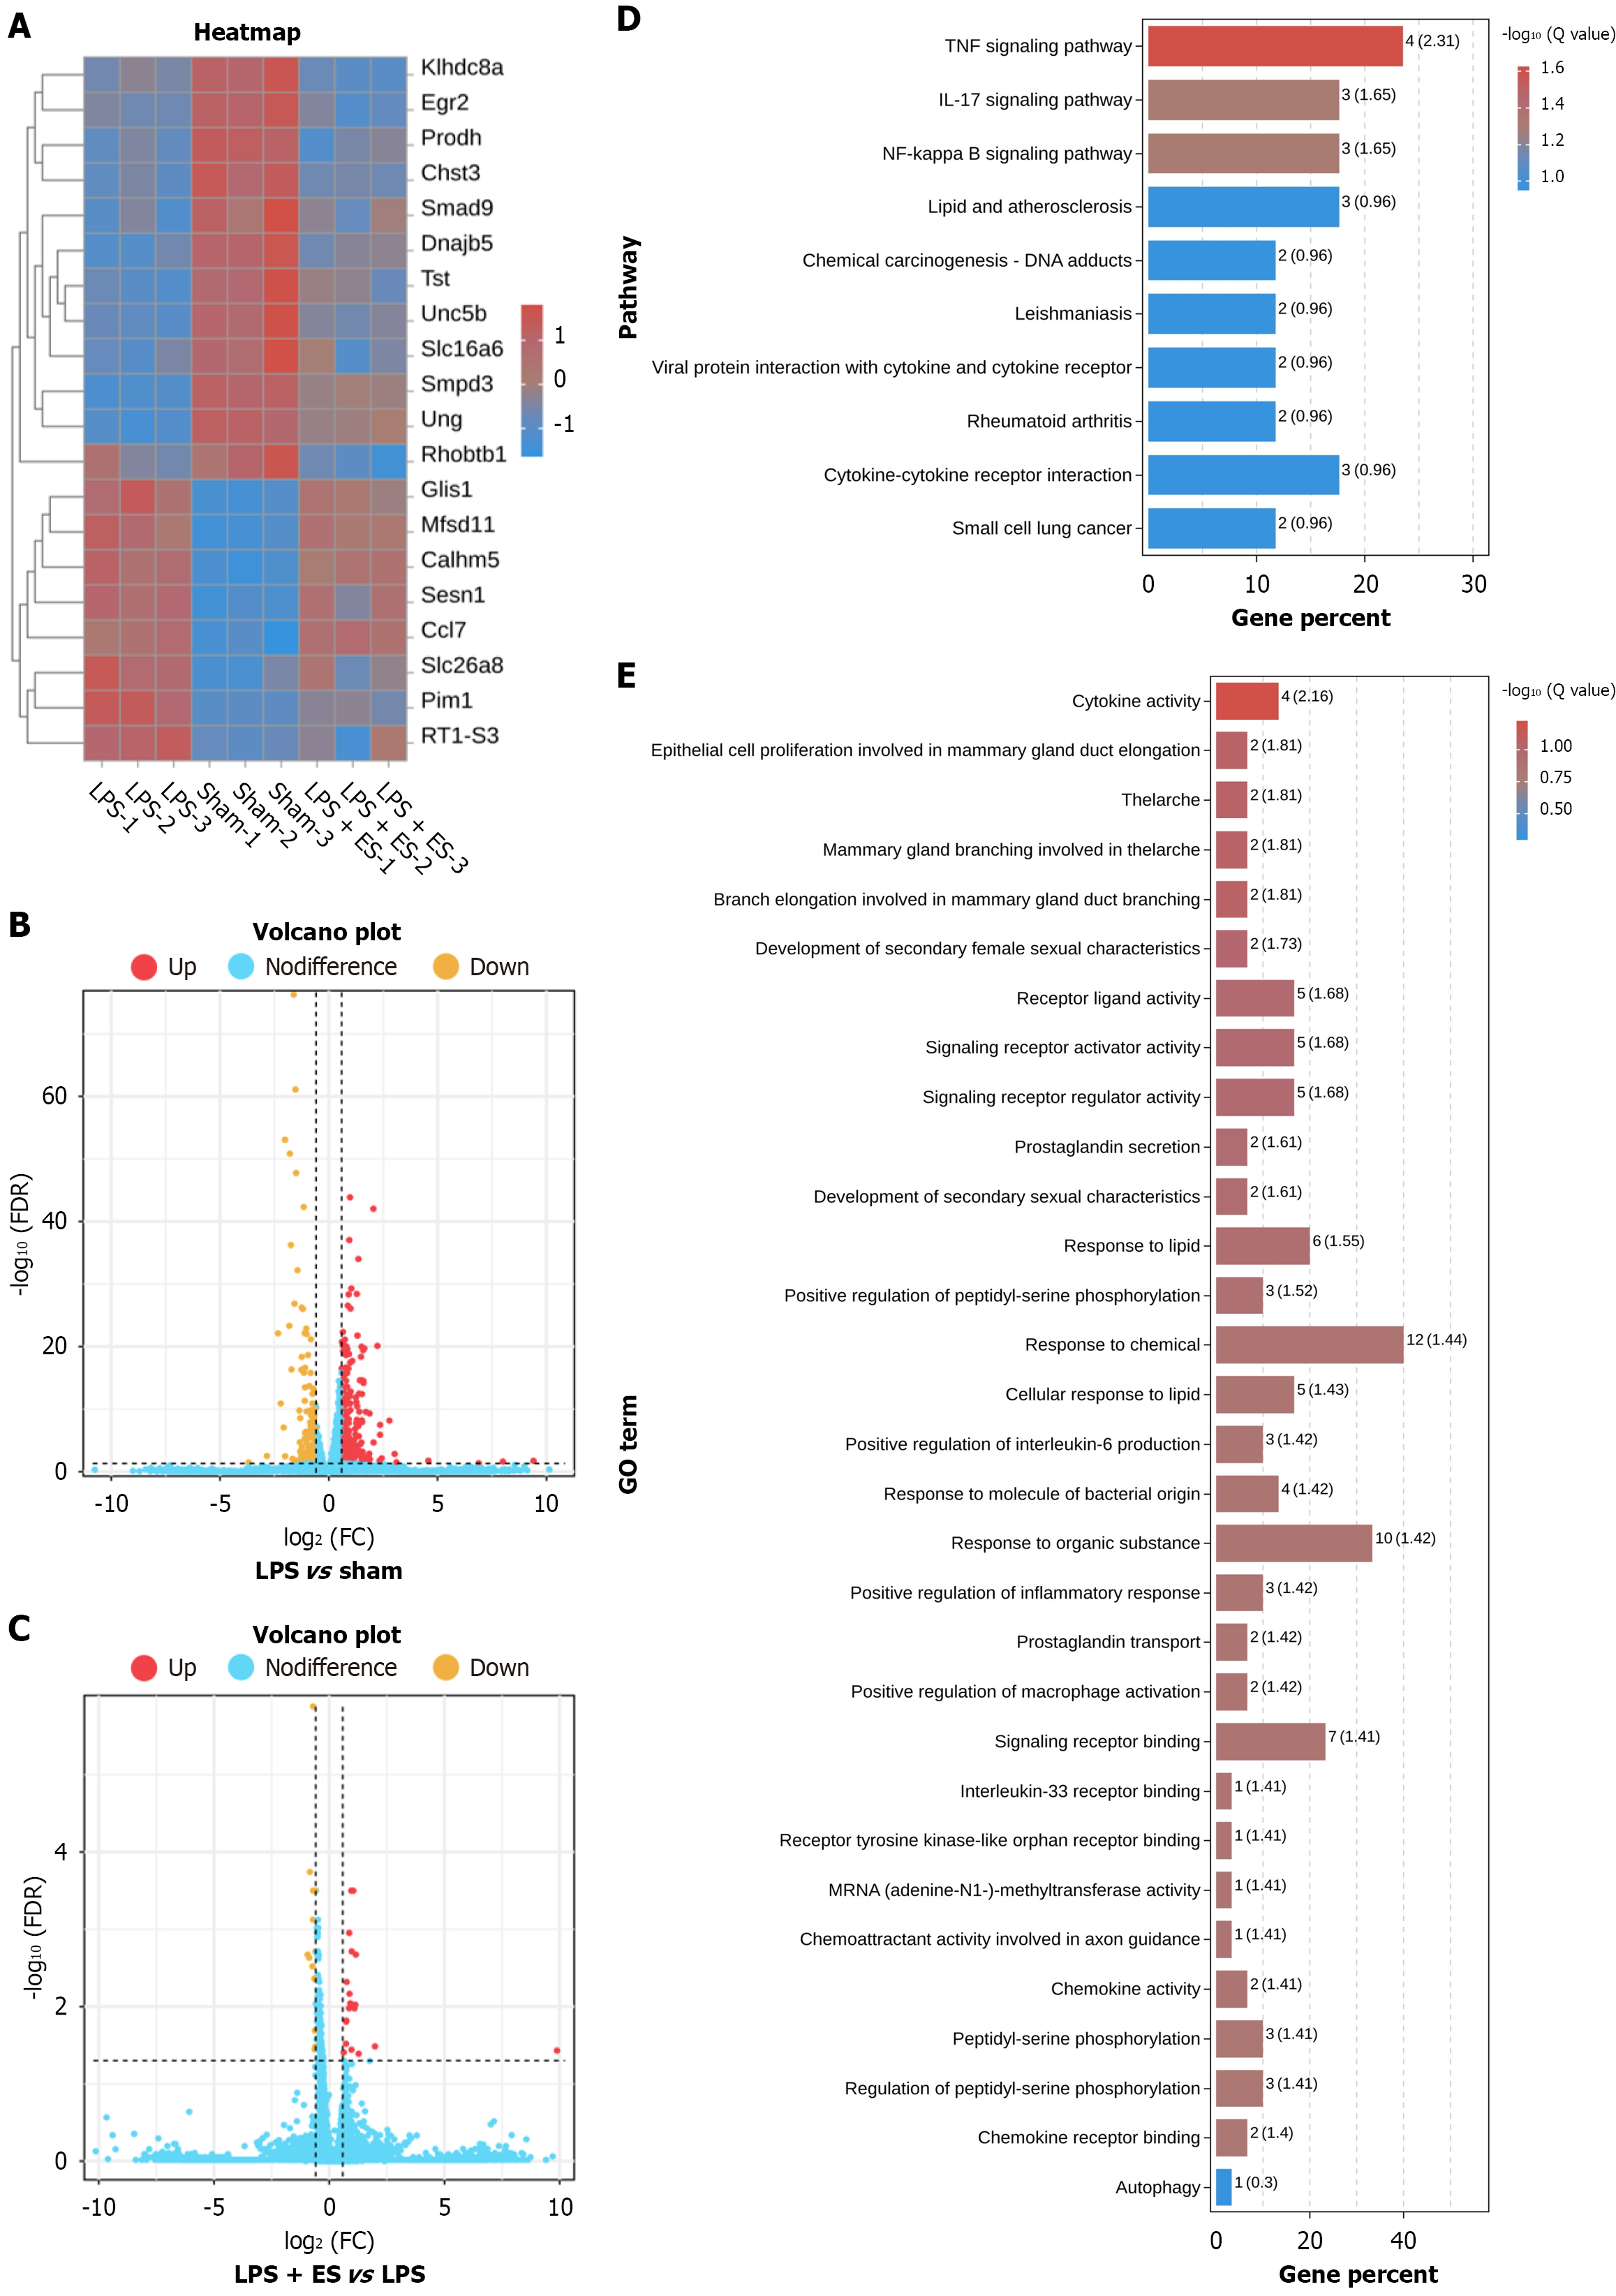
Figure 10 Esmolol regulates the expression of genes related to sepsis.
A: Heatmap for hierarchical cluster analysis of differentially expressed genes (DEGs) between the groups. Red denotes high expression, and blue denotes low expression; B: Volcano plots of upregulated and downregulated DEGs between the lipopolysaccharide (LPS) and Sham groups; C: Volcano plots of upregulated and downregulated DEGs between the LPS + esmolol and LPS groups; D: Kyoto Encyclopedia of Genes and Genomes functional enrichment analysis; E: Gene Ontology functional enrichment analysis. n = 3 in each group. ES: Esmolol; LPS: Lipopolysaccharide.
- Citation: Zhang YB, Yu ZJ, Jin J, Liu MX, Ji FH, Yang XJ. Esmolol alleviates lipopolysaccharide-induced intestinal injuries by enhancing autophagy through the AMPK/mTOR/ULK1 pathway. World J Gastroenterol 2026; 32(23): 117320
- URL: https://www.wjgnet.com/1007-9327/full/v32/i23/117320.htm
- DOI: https://dx.doi.org/10.3748/wjg.v32.i23.117320