
















Copyright: ©Author(s) 2026.
World J Gastroenterol. Jun 21, 2026; 32(23): 117320
Published online Jun 21, 2026. doi: 10.3748/wjg.v32.i23.117320
Published online Jun 21, 2026. doi: 10.3748/wjg.v32.i23.117320
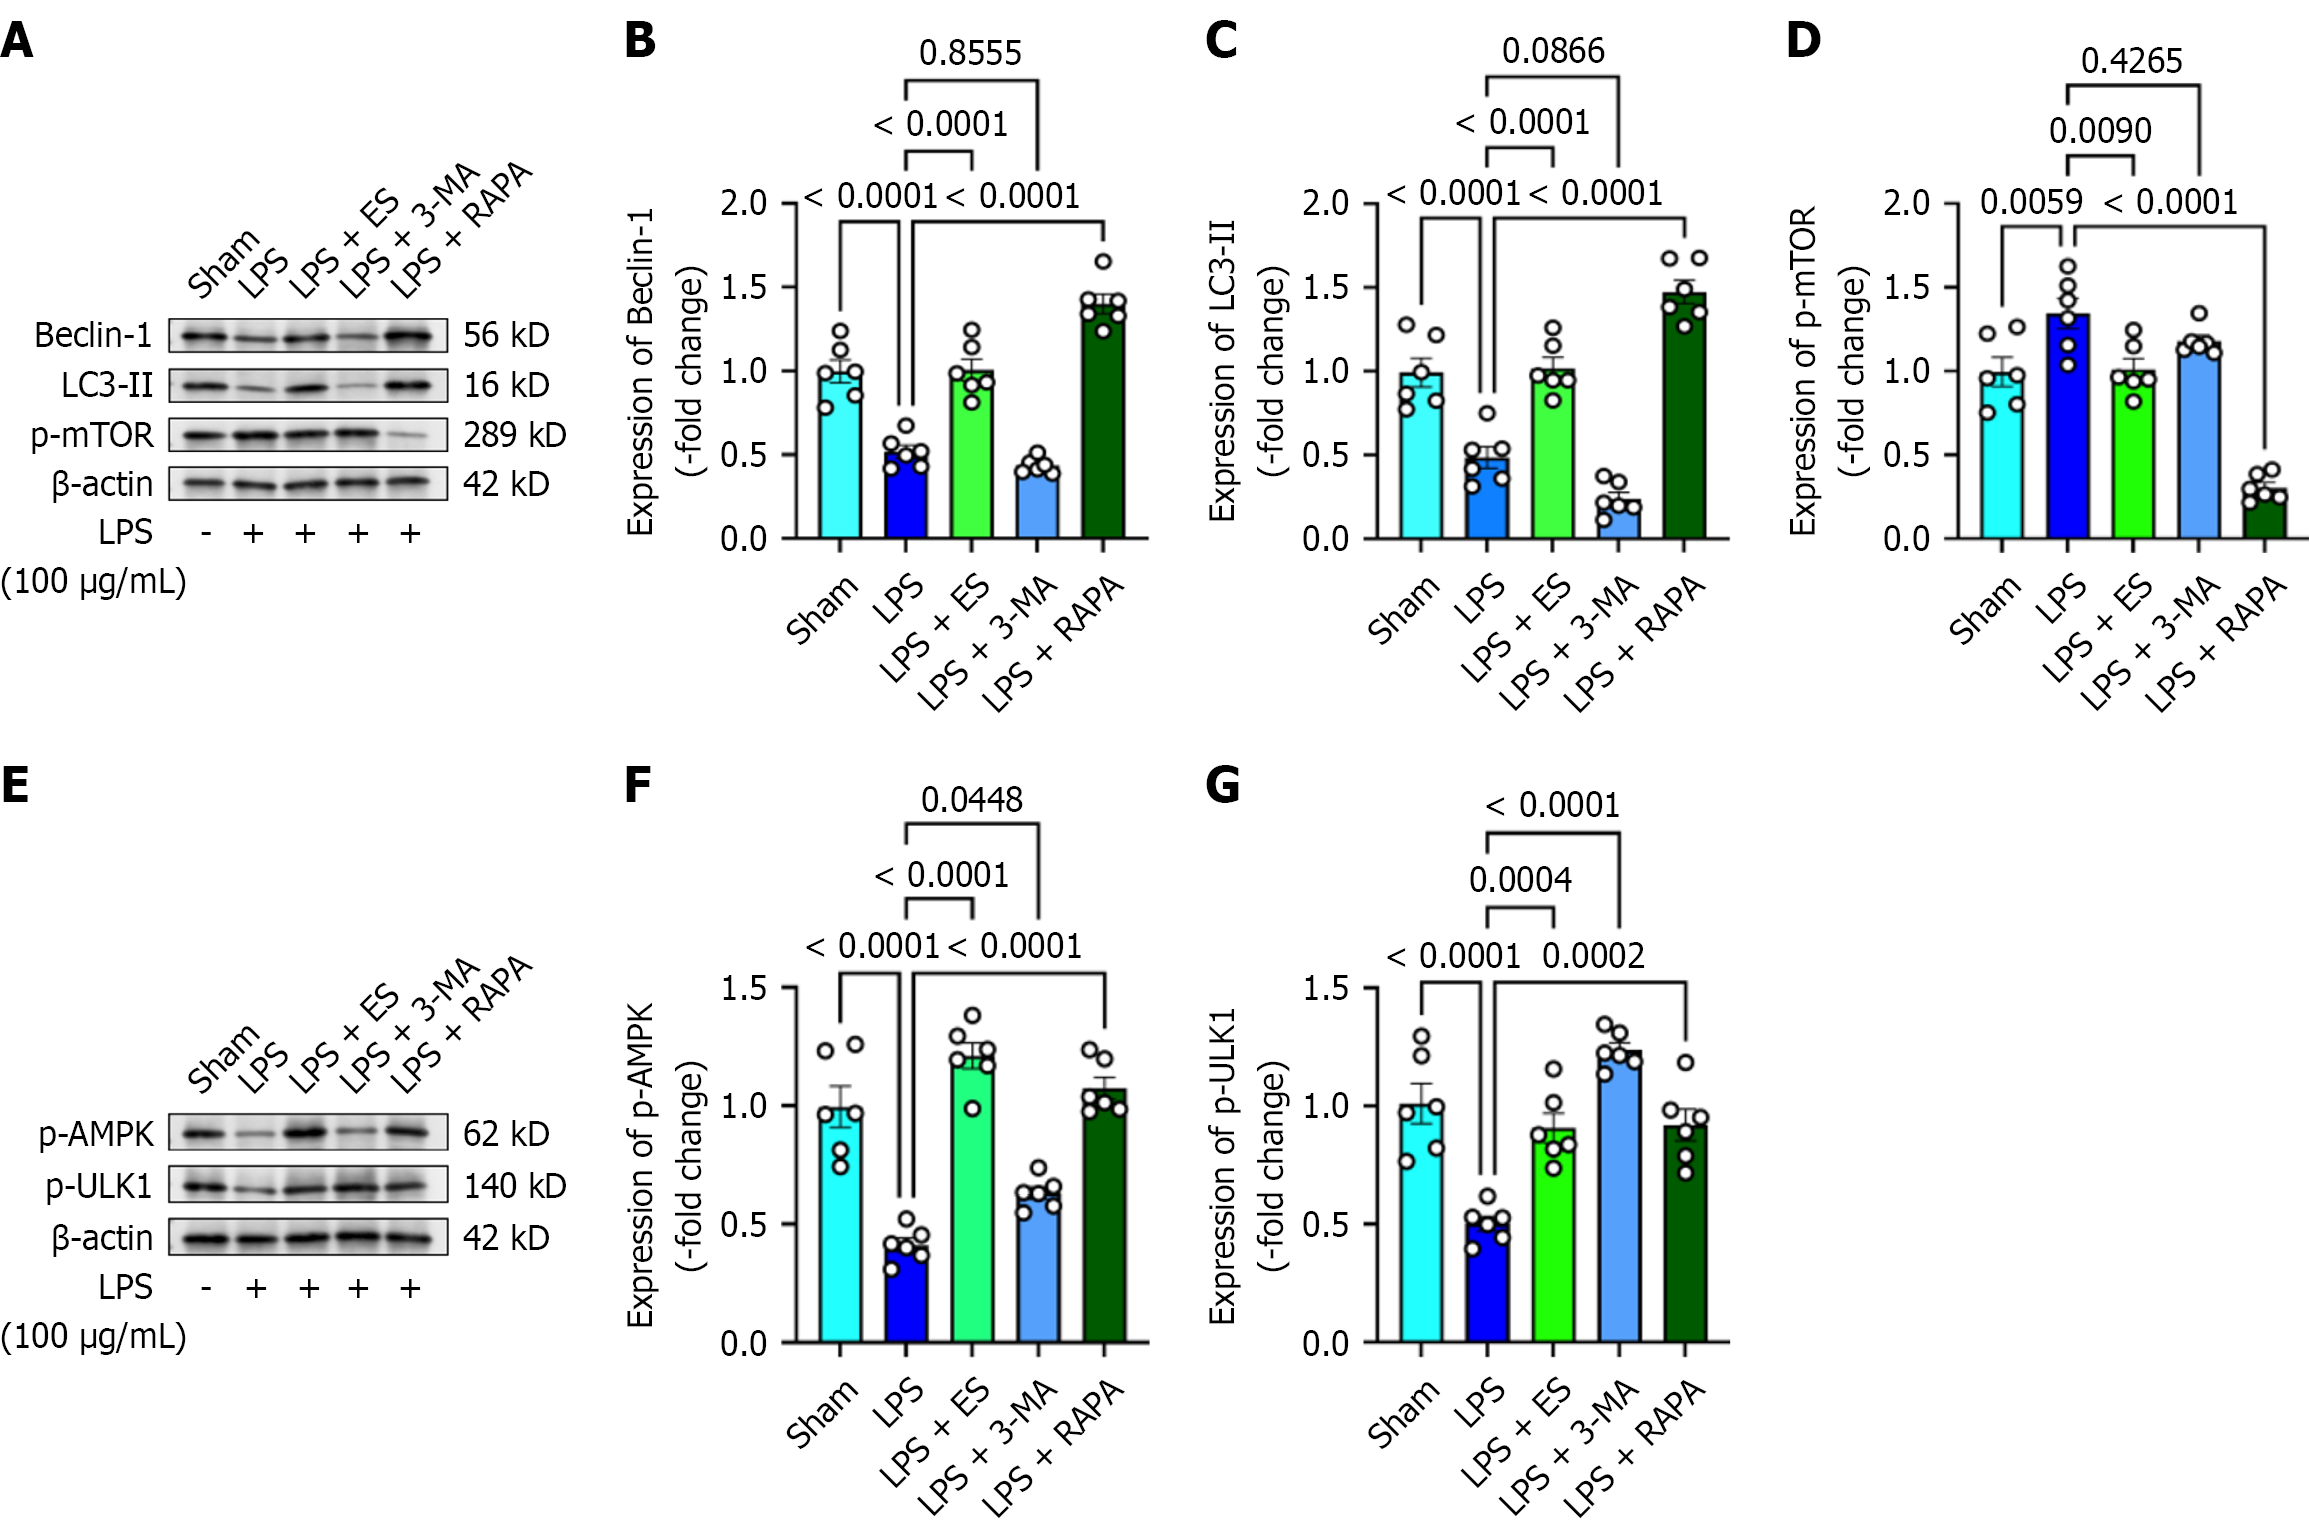
Figure 9 Western blot analysis was performed for Beclin-1, LC3-II, p-AMPK, p-ULK1, and p-mTOR in IEC-6 cells in the Sham, lipo
- Citation: Zhang YB, Yu ZJ, Jin J, Liu MX, Ji FH, Yang XJ. Esmolol alleviates lipopolysaccharide-induced intestinal injuries by enhancing autophagy through the AMPK/mTOR/ULK1 pathway. World J Gastroenterol 2026; 32(23): 117320
- URL: https://www.wjgnet.com/1007-9327/full/v32/i23/117320.htm
- DOI: https://dx.doi.org/10.3748/wjg.v32.i23.117320