
















Copyright: ©Author(s) 2026.
World J Gastroenterol. Jun 14, 2026; 32(22): 117194
Published online Jun 14, 2026. doi: 10.3748/wjg.v32.i22.117194
Published online Jun 14, 2026. doi: 10.3748/wjg.v32.i22.117194
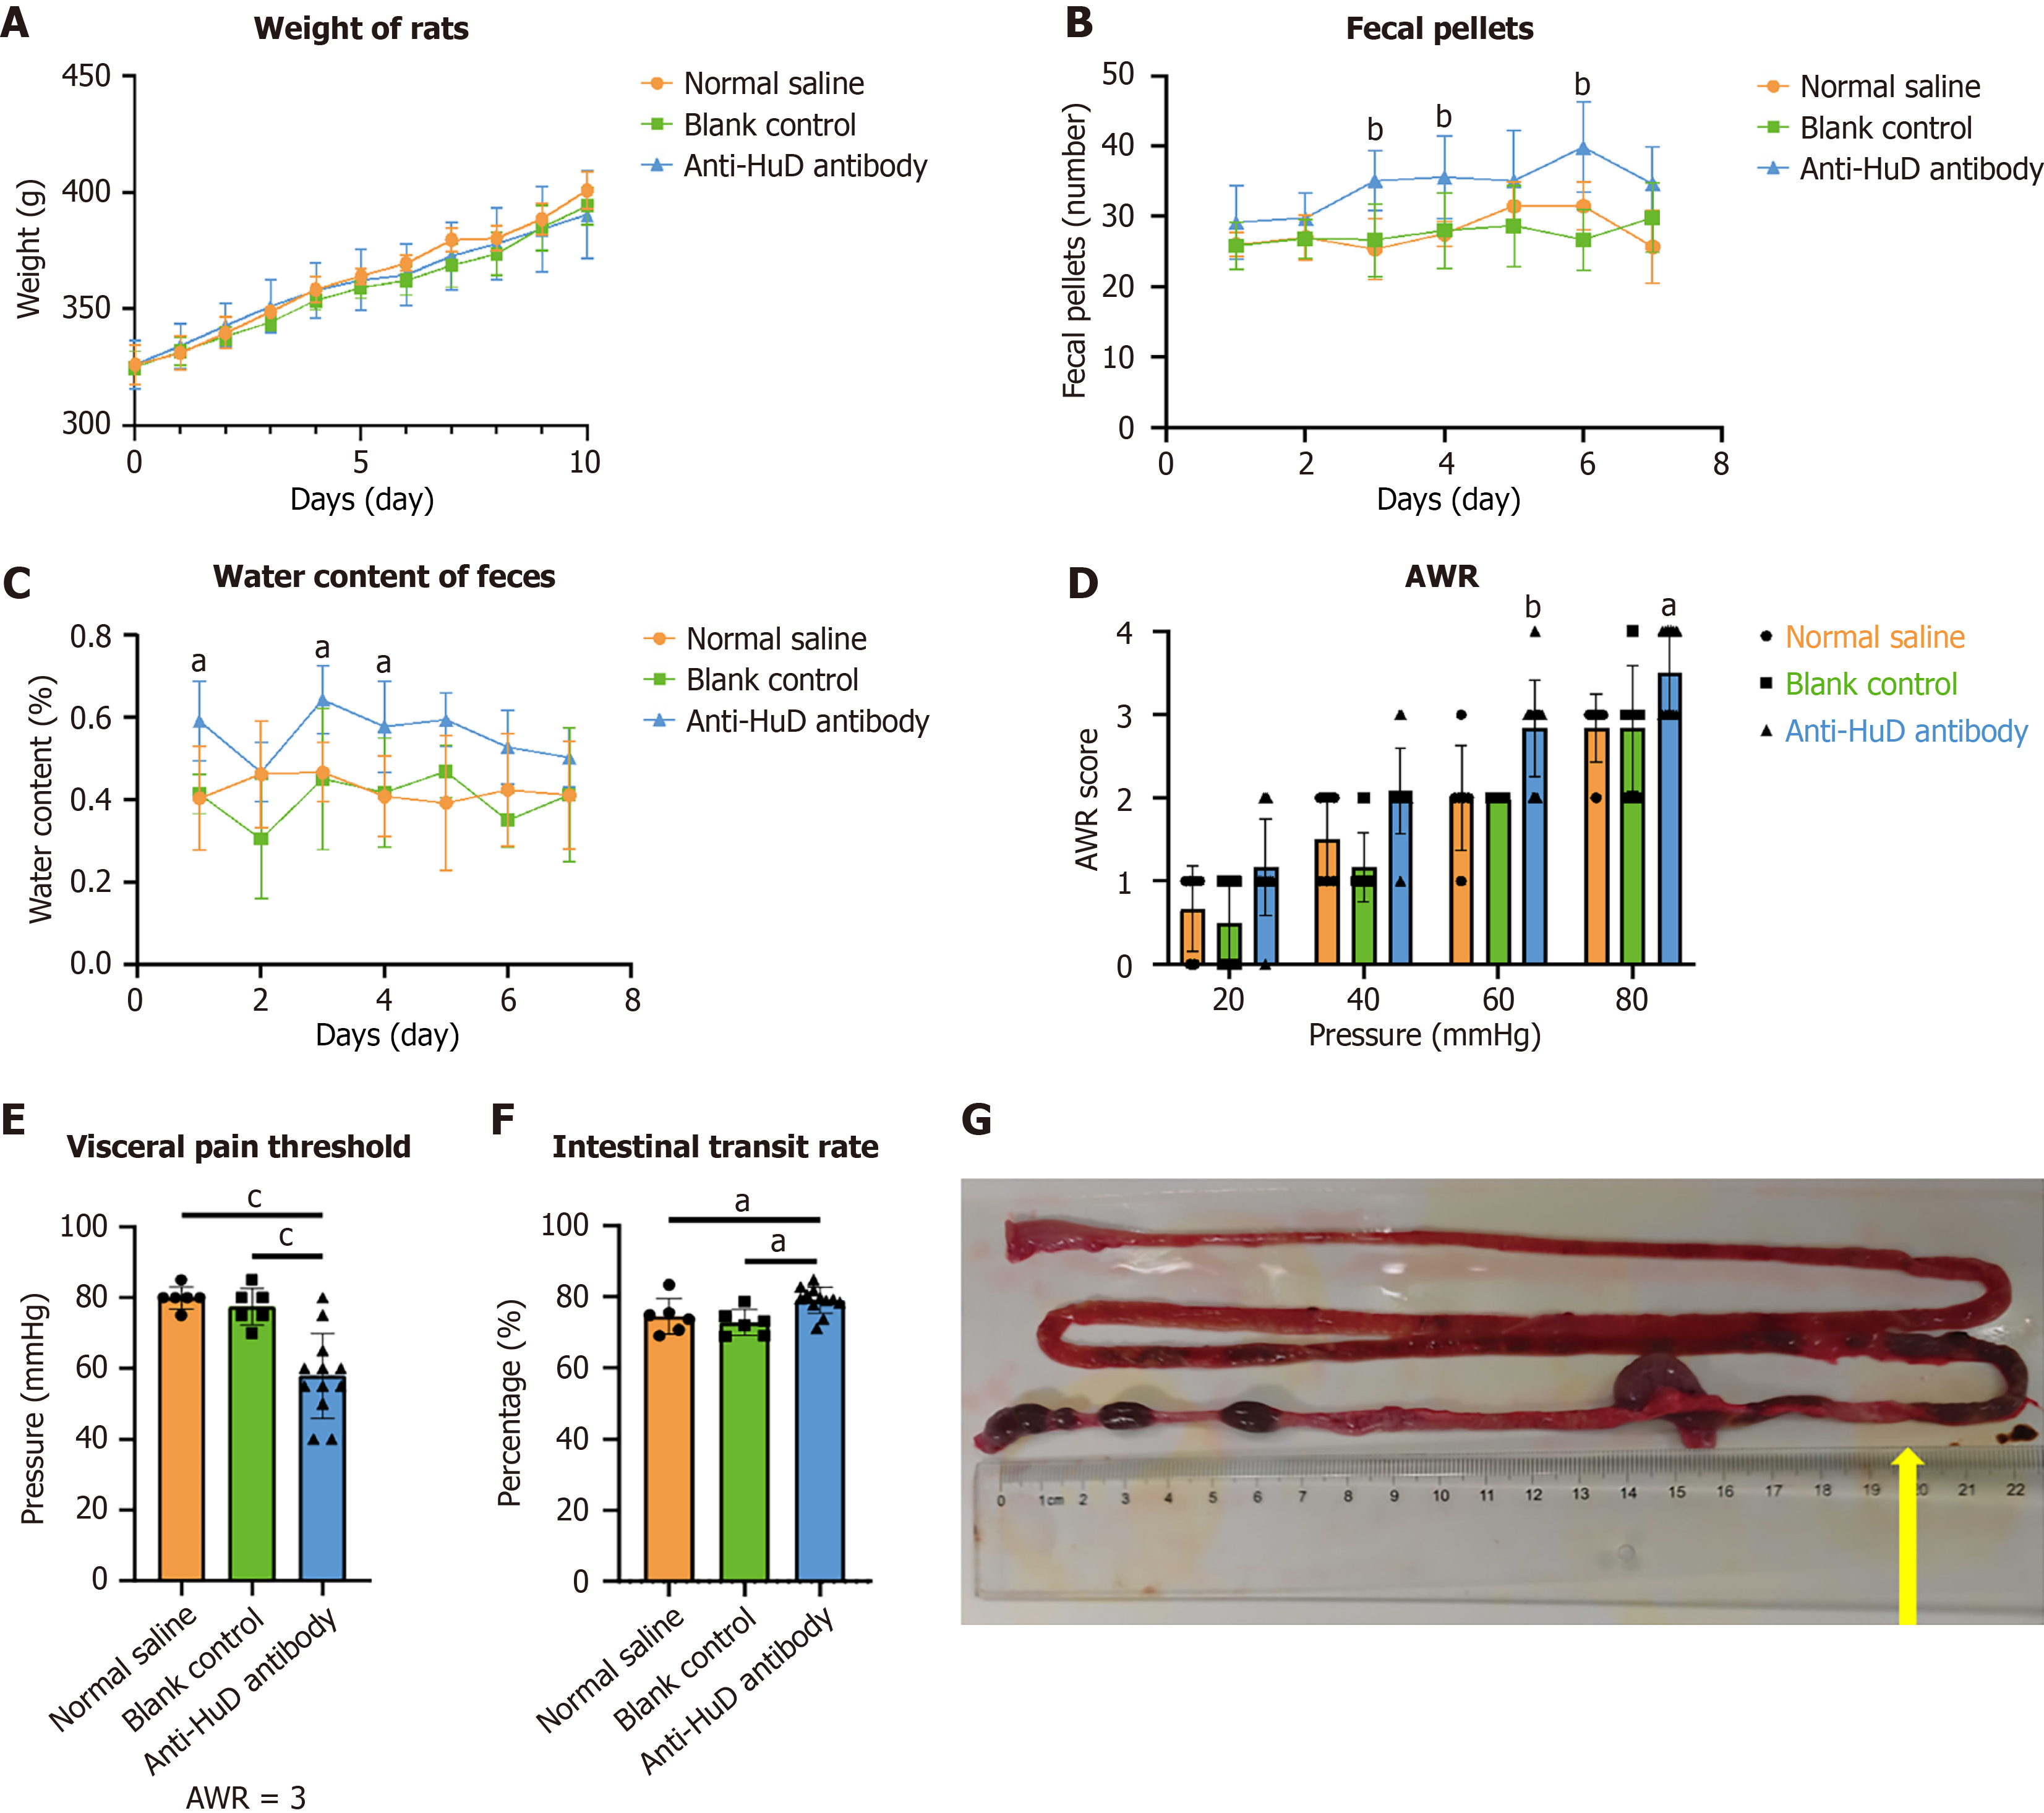
Figure 1 Indicators of the irritable bowel syndrome model established by passive transfer of a commercial anti-HuD autoantibody.
A: Changes in body weight of the three groups of rats during the observation period; B: Changes in the number of fecal pellets of the three groups of rats during the observation period; C: Changes in the water content of feces of the three groups of rats during the observation period; D: Abdominal withdrawal reflex scores of three groups of rats under different pressures; E: Recorded pressure of three groups of rats during abdominal withdrawal reflex in which 3 represents the visceral pain threshold; F: Comparison of the intestinal transit rate of the three groups of rats; G: Representative image of the propelling distance of activated carbon powder in the intestine shown by the arrow. Data are expressed as mean ± SD. B-D were analyzed by two-way analysis of variance with Tukey’s multiple comparison test; E and F were analyzed by one-way analysis of variance with Tukey’s multiple comparison test. For A-F, n = 6 for the normal saline group and blank control group and n = 12 for the HuD autoantibody group. aP < 0.05, bP < 0.01, and cP < 0.001.
- Citation: Zhang Y, Zhu C, Xia SH, Zhang MY, Liu YR, Guan JL, Huang YJ, Zhao K, Liao JZ, Fan WJ. Mechanism of anti-human antigen D (HuD/ELAVL4) autoantibody-induced enteric neuronal apoptosis in irritable bowel syndrome and its potential for targeted intervention. World J Gastroenterol 2026; 32(22): 117194
- URL: https://www.wjgnet.com/1007-9327/full/v32/i22/117194.htm
- DOI: https://dx.doi.org/10.3748/wjg.v32.i22.117194