
















Copyright: ©Author(s) 2026.
World J Gastroenterol. May 28, 2026; 32(20): 117603
Published online May 28, 2026. doi: 10.3748/wjg.v32.i20.117603
Published online May 28, 2026. doi: 10.3748/wjg.v32.i20.117603
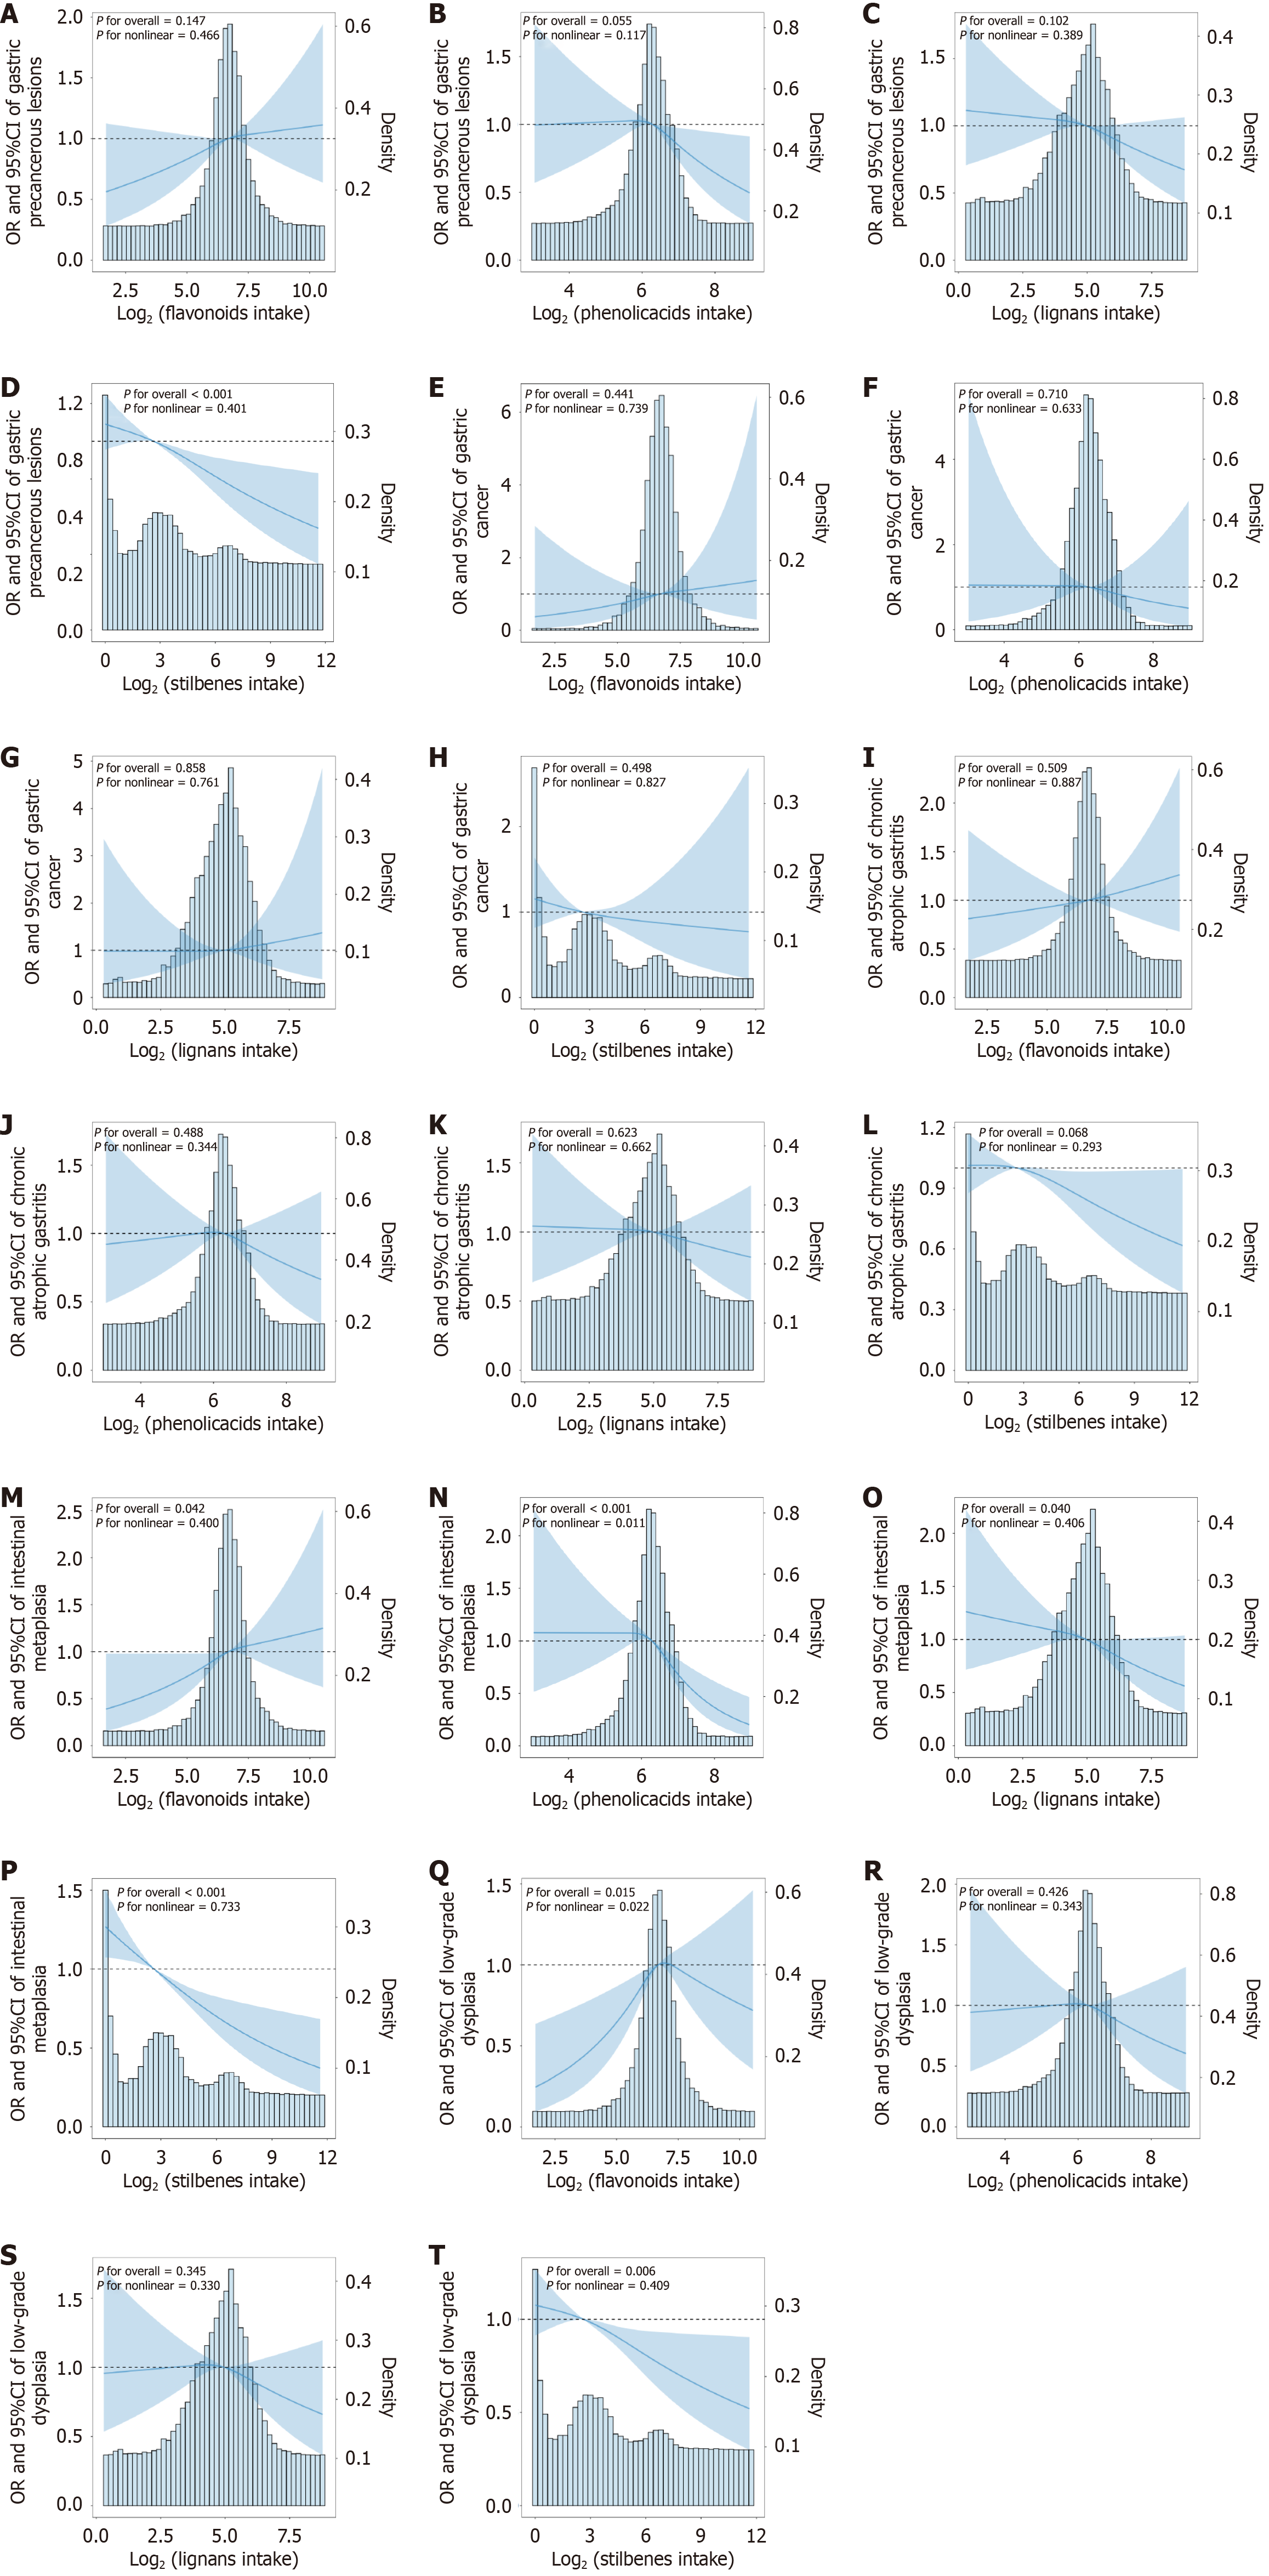
Figure 3 Restricted cubic spline curves.
A-H: For the relationships between dietary polyphenol intake and the risks of gastric precancerous lesions (GPL) and gastric cancer (GC). A: Flavonoids and GPL risk; B: Phenolic acids and GPL risk; C: Lignans and GPL risk; D: Stilbenes and GPL risk; E: Flavonoids and GC risk; F: Phenolic acids and GC risk; G: Lignans and GC risk; H: Stilbenes and GC risk; I-T: For the relationships between dietary polyphenol intake and the risks of subtypes of gastric precancerous lesions. I: Flavonoids and chronic atrophic gastritis (CAG) risk; J: Phenolic acids and CAG risk; K: Lignans and CAG risk; L: Stilbenes and CAG risk; M: Flavonoids and intestinal metaplasia (IM) risk; N: Phenolic acids and IM risk; O: Lignans and IM risk; P: Stilbenes and IM risk; Q: Flavonoids and low-grade dysplasia (LGD) risk; R: Phenolic acids and LGD risk; S: Lignans and LGD risk; T: Stilbenes and LGD risk. The adjusted odds ratios (solid lines) and 95% confidence intervals (shaded areas) were calculated based on restricted cubic spline models for log2-transformed dietary polyphenol intake. The median intake (50th percentile) was set as the reference value (odds ratio = 1.00), with knots placed at the 5th, 50th, and 95th percentiles. All models were adjusted for sex, age, education, occupation, income, smoking, alcohol consumption, body mass index, Helicobacter pylori status, family history of digestive cancer, and mutually for all other polyphenol subclasses. OR: Odds ratio; CI: Confidence interval.
- Citation: Li MT, Zheng Y, Zhao JY, Wu ZQ, Lu LZ, Sun J, Li Q, Shu XC, Naji WQ, Yang J, Chen FF, Ma XM, Zhang HY, Yang FC, Du LL, Xie YD, Du PW, Kong WR, Yuan H, Ji R, Guo QH, Chen ZF, Wang YP, Zhou YN. Associations between dietary polyphenols and risks of gastric precancerous lesions and cancer. World J Gastroenterol 2026; 32(20): 117603
- URL: https://www.wjgnet.com/1007-9327/full/v32/i20/117603.htm
- DOI: https://dx.doi.org/10.3748/wjg.v32.i20.117603