
















Copyright: ©Author(s) 2026.
World J Gastroenterol. May 28, 2026; 32(20): 117603
Published online May 28, 2026. doi: 10.3748/wjg.v32.i20.117603
Published online May 28, 2026. doi: 10.3748/wjg.v32.i20.117603
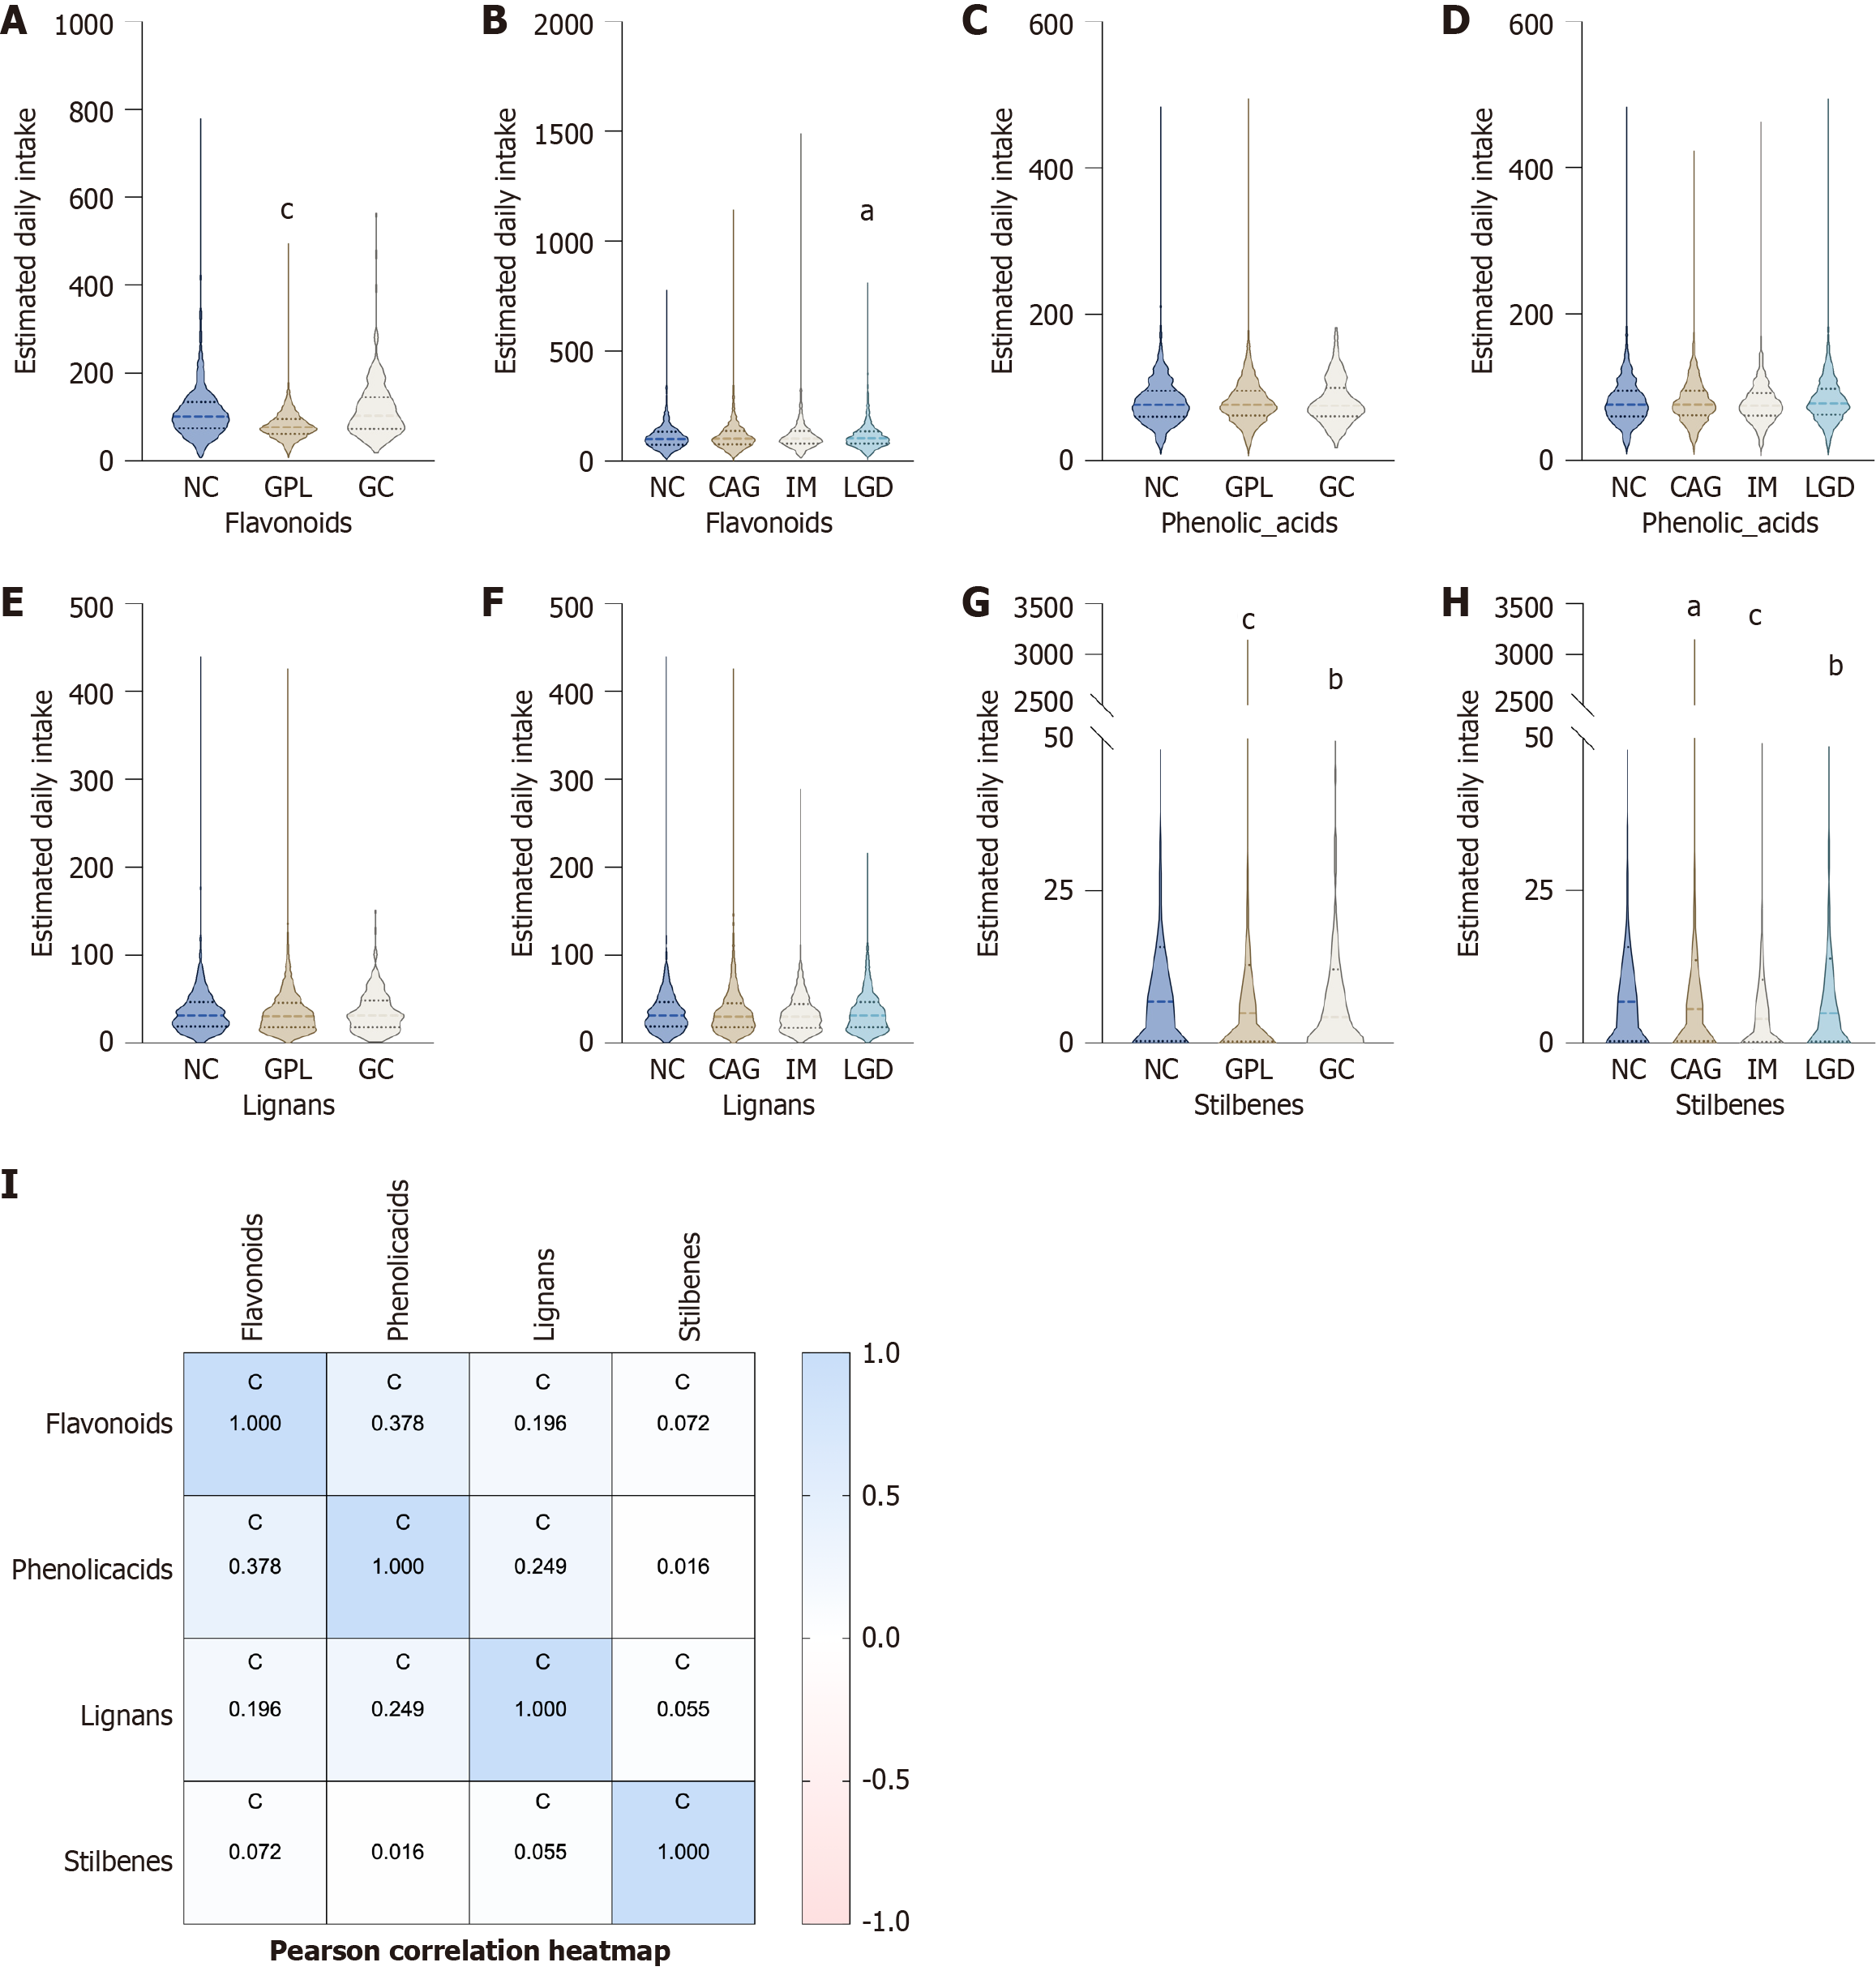
Figure 2 Distribution of dietary polyphenol intake across different gastric disease groups.
A-H: Violin plots show the estimated daily intake of four polyphenol subclasses: Flavonoids (A and B), phenolic acids (C and D), lignans (E and F), and stilbenes (G and H). The midline indicates the median; the upper and lower edges correspond to the first and third quartiles, respectively. Between group differences were assessed using the Kruskal-Wallis test followed by Dunn’s multiple comparison test; I: Heatmap of Pearson correlation coefficients among the four polyphenol subclasses. Correlations were evaluated using Pearson correlation analysis. aP < 0.05. bP < 0.01. cP < 0.001. P vs normal control group. Values in the heatmap represent the correlation coefficient r. NC: Normal control; GPL: Gastric precancerous lesions; GC: Gastric cancer; CAG: Chronic atrophic gastritis; IM: Intestinal metaplasia; LGD: Low-grade dysplasia.
- Citation: Li MT, Zheng Y, Zhao JY, Wu ZQ, Lu LZ, Sun J, Li Q, Shu XC, Naji WQ, Yang J, Chen FF, Ma XM, Zhang HY, Yang FC, Du LL, Xie YD, Du PW, Kong WR, Yuan H, Ji R, Guo QH, Chen ZF, Wang YP, Zhou YN. Associations between dietary polyphenols and risks of gastric precancerous lesions and cancer. World J Gastroenterol 2026; 32(20): 117603
- URL: https://www.wjgnet.com/1007-9327/full/v32/i20/117603.htm
- DOI: https://dx.doi.org/10.3748/wjg.v32.i20.117603