
















©The Author(s) 2026.
World J Gastroenterol. Jan 14, 2026; 32(2): 113810
Published online Jan 14, 2026. doi: 10.3748/wjg.v32.i2.113810
Published online Jan 14, 2026. doi: 10.3748/wjg.v32.i2.113810
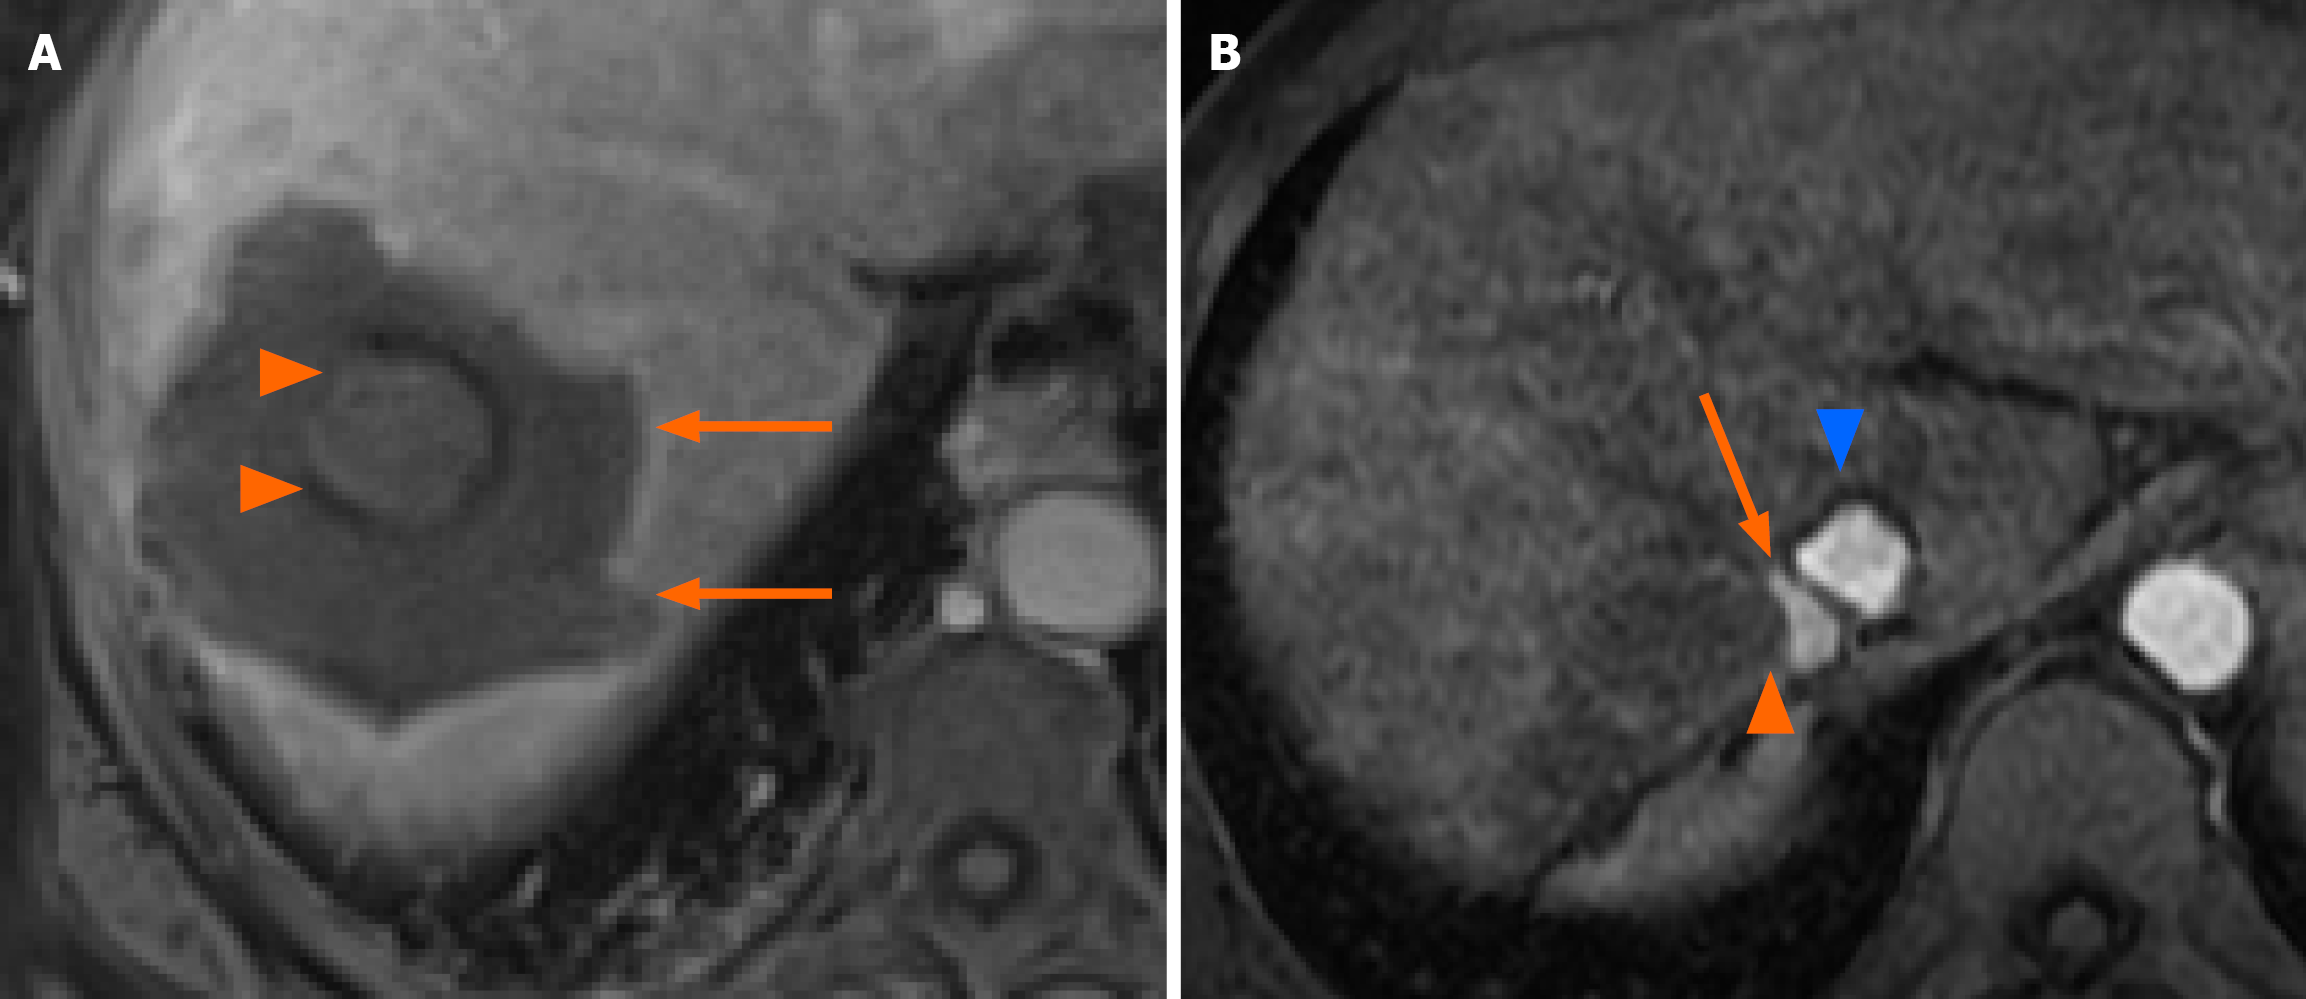
Figure 2 Representative depictions of ablation margins and local tumor progression after thermoablation on magnetic resonance imaging.
A: A portal phase magnetic resonance imaging performed one month post multibipolar radiofrequency ablation showing optimal (> 5 mm) ablation margins between the original lesion (arrowheads) and the ablation zone (arrows); B: An arterial phase magnetic resonance imaging showing the appearance of a local tumor progression (arrow) after microwave ablation occurring between the ablation zone (arrowhead) and the inferior vena cava (blue arrowhead).
- Citation: Bahloul C, Rode A, Pradat P, Milot L, Dumortier J, Merle P, Mabrut JY, Boussel L, Della Corte A. Multibipolar radiofrequency vs single needle microwave ablation for the treatment of newly diagnosed hepatocellular carcinoma. World J Gastroenterol 2026; 32(2): 113810
- URL: https://www.wjgnet.com/1007-9327/full/v32/i2/113810.htm
- DOI: https://dx.doi.org/10.3748/wjg.v32.i2.113810