
















Copyright: ©Author(s) 2026.
World J Gastroenterol. May 21, 2026; 32(19): 116271
Published online May 21, 2026. doi: 10.3748/wjg.v32.i19.116271
Published online May 21, 2026. doi: 10.3748/wjg.v32.i19.116271
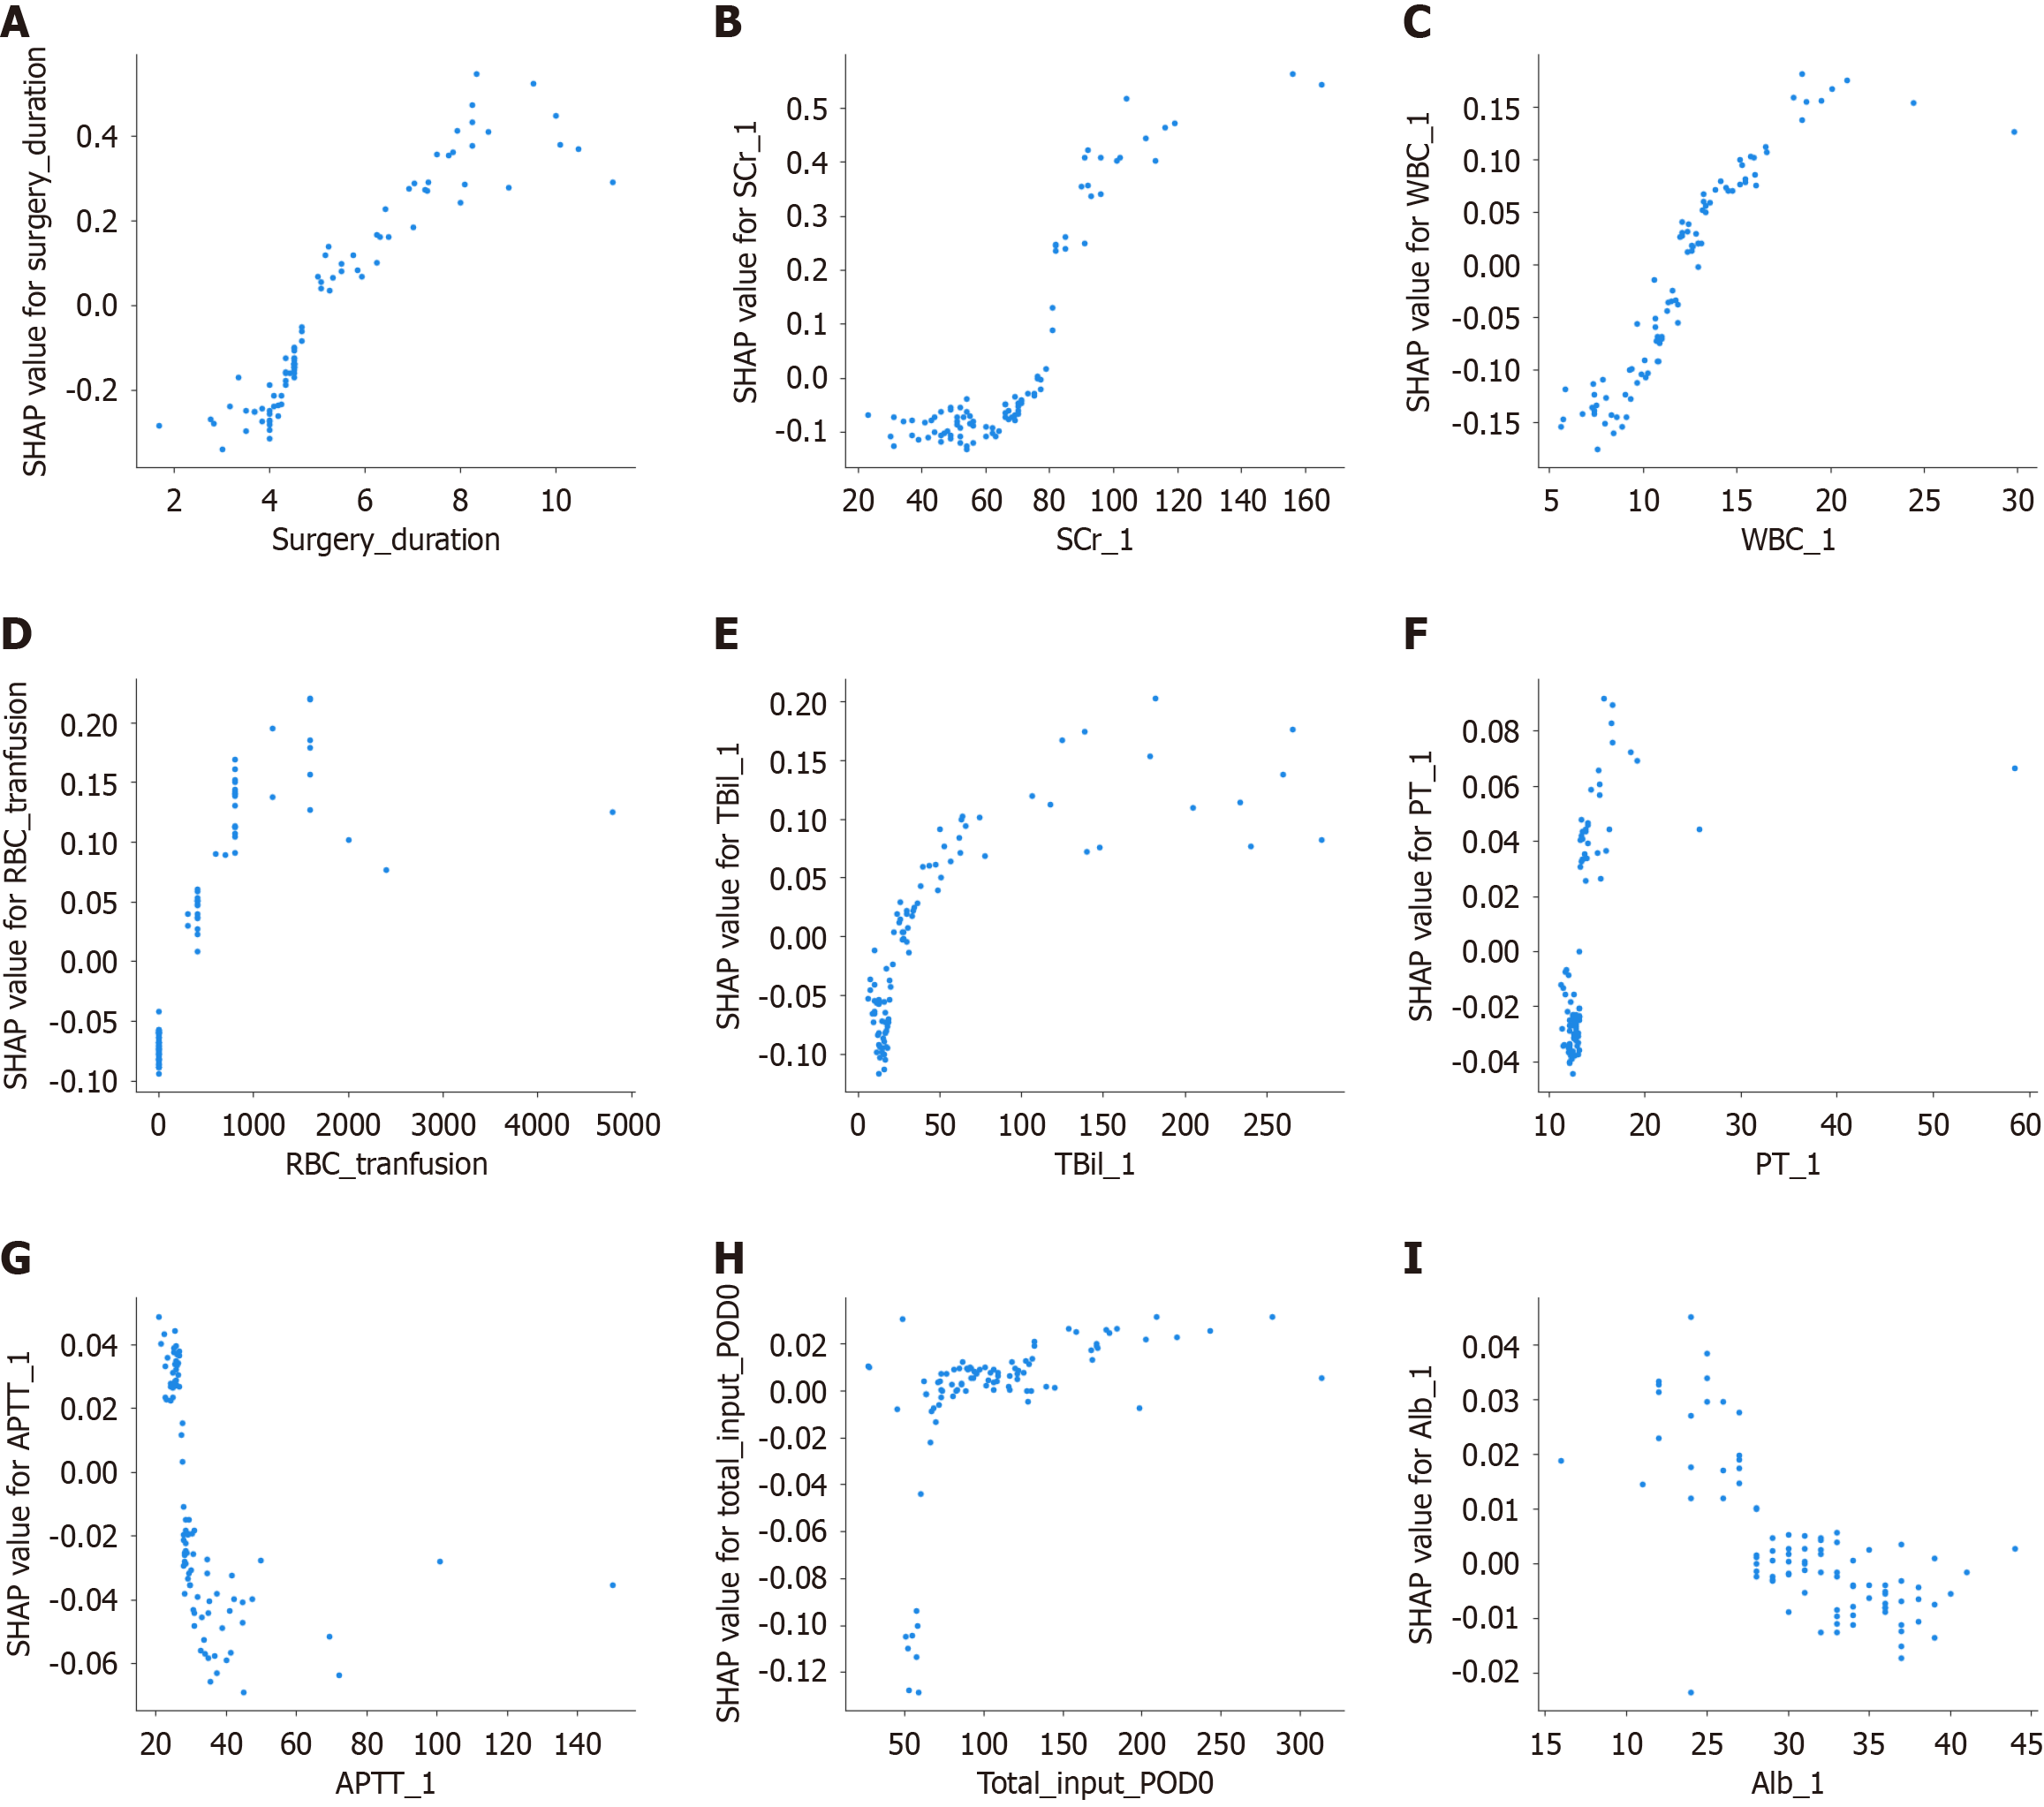
Figure 7 SHapley Additive exPlanations dependence plot of the categorical boosting model.
Each panel shows that each feature affects the output of the final model. A: Operative time; B: Postoperative serum creatinine; C: Postoperative white blood cell count; D: Intraoperative red blood cell transfusion; E: Postoperative bilirubin; F: Postoperative prothrombin time; G: Postoperative activated partial thromboplastin time; H: Total input on the day of surgery; I: Post
- Citation: Lin C, Fu RK, Zheng H, Li TY, Han JS, Margonis GA, Wang JJ, Dong LB, Wang NS, Sun YX, Wang YZ, Liu C, Xu Q, Han XL, Zhang TP, Guo JC, Dai MH, Xia P, Chen LM, Wang WB. Development and validation of an interpretable machine learning model for predicting acute kidney injury after pancreatic surgery. World J Gastroenterol 2026; 32(19): 116271
- URL: https://www.wjgnet.com/1007-9327/full/v32/i19/116271.htm
- DOI: https://dx.doi.org/10.3748/wjg.v32.i19.116271