
















Copyright: ©Author(s) 2026.
World J Gastroenterol. May 21, 2026; 32(19): 115852
Published online May 21, 2026. doi: 10.3748/wjg.v32.i19.115852
Published online May 21, 2026. doi: 10.3748/wjg.v32.i19.115852
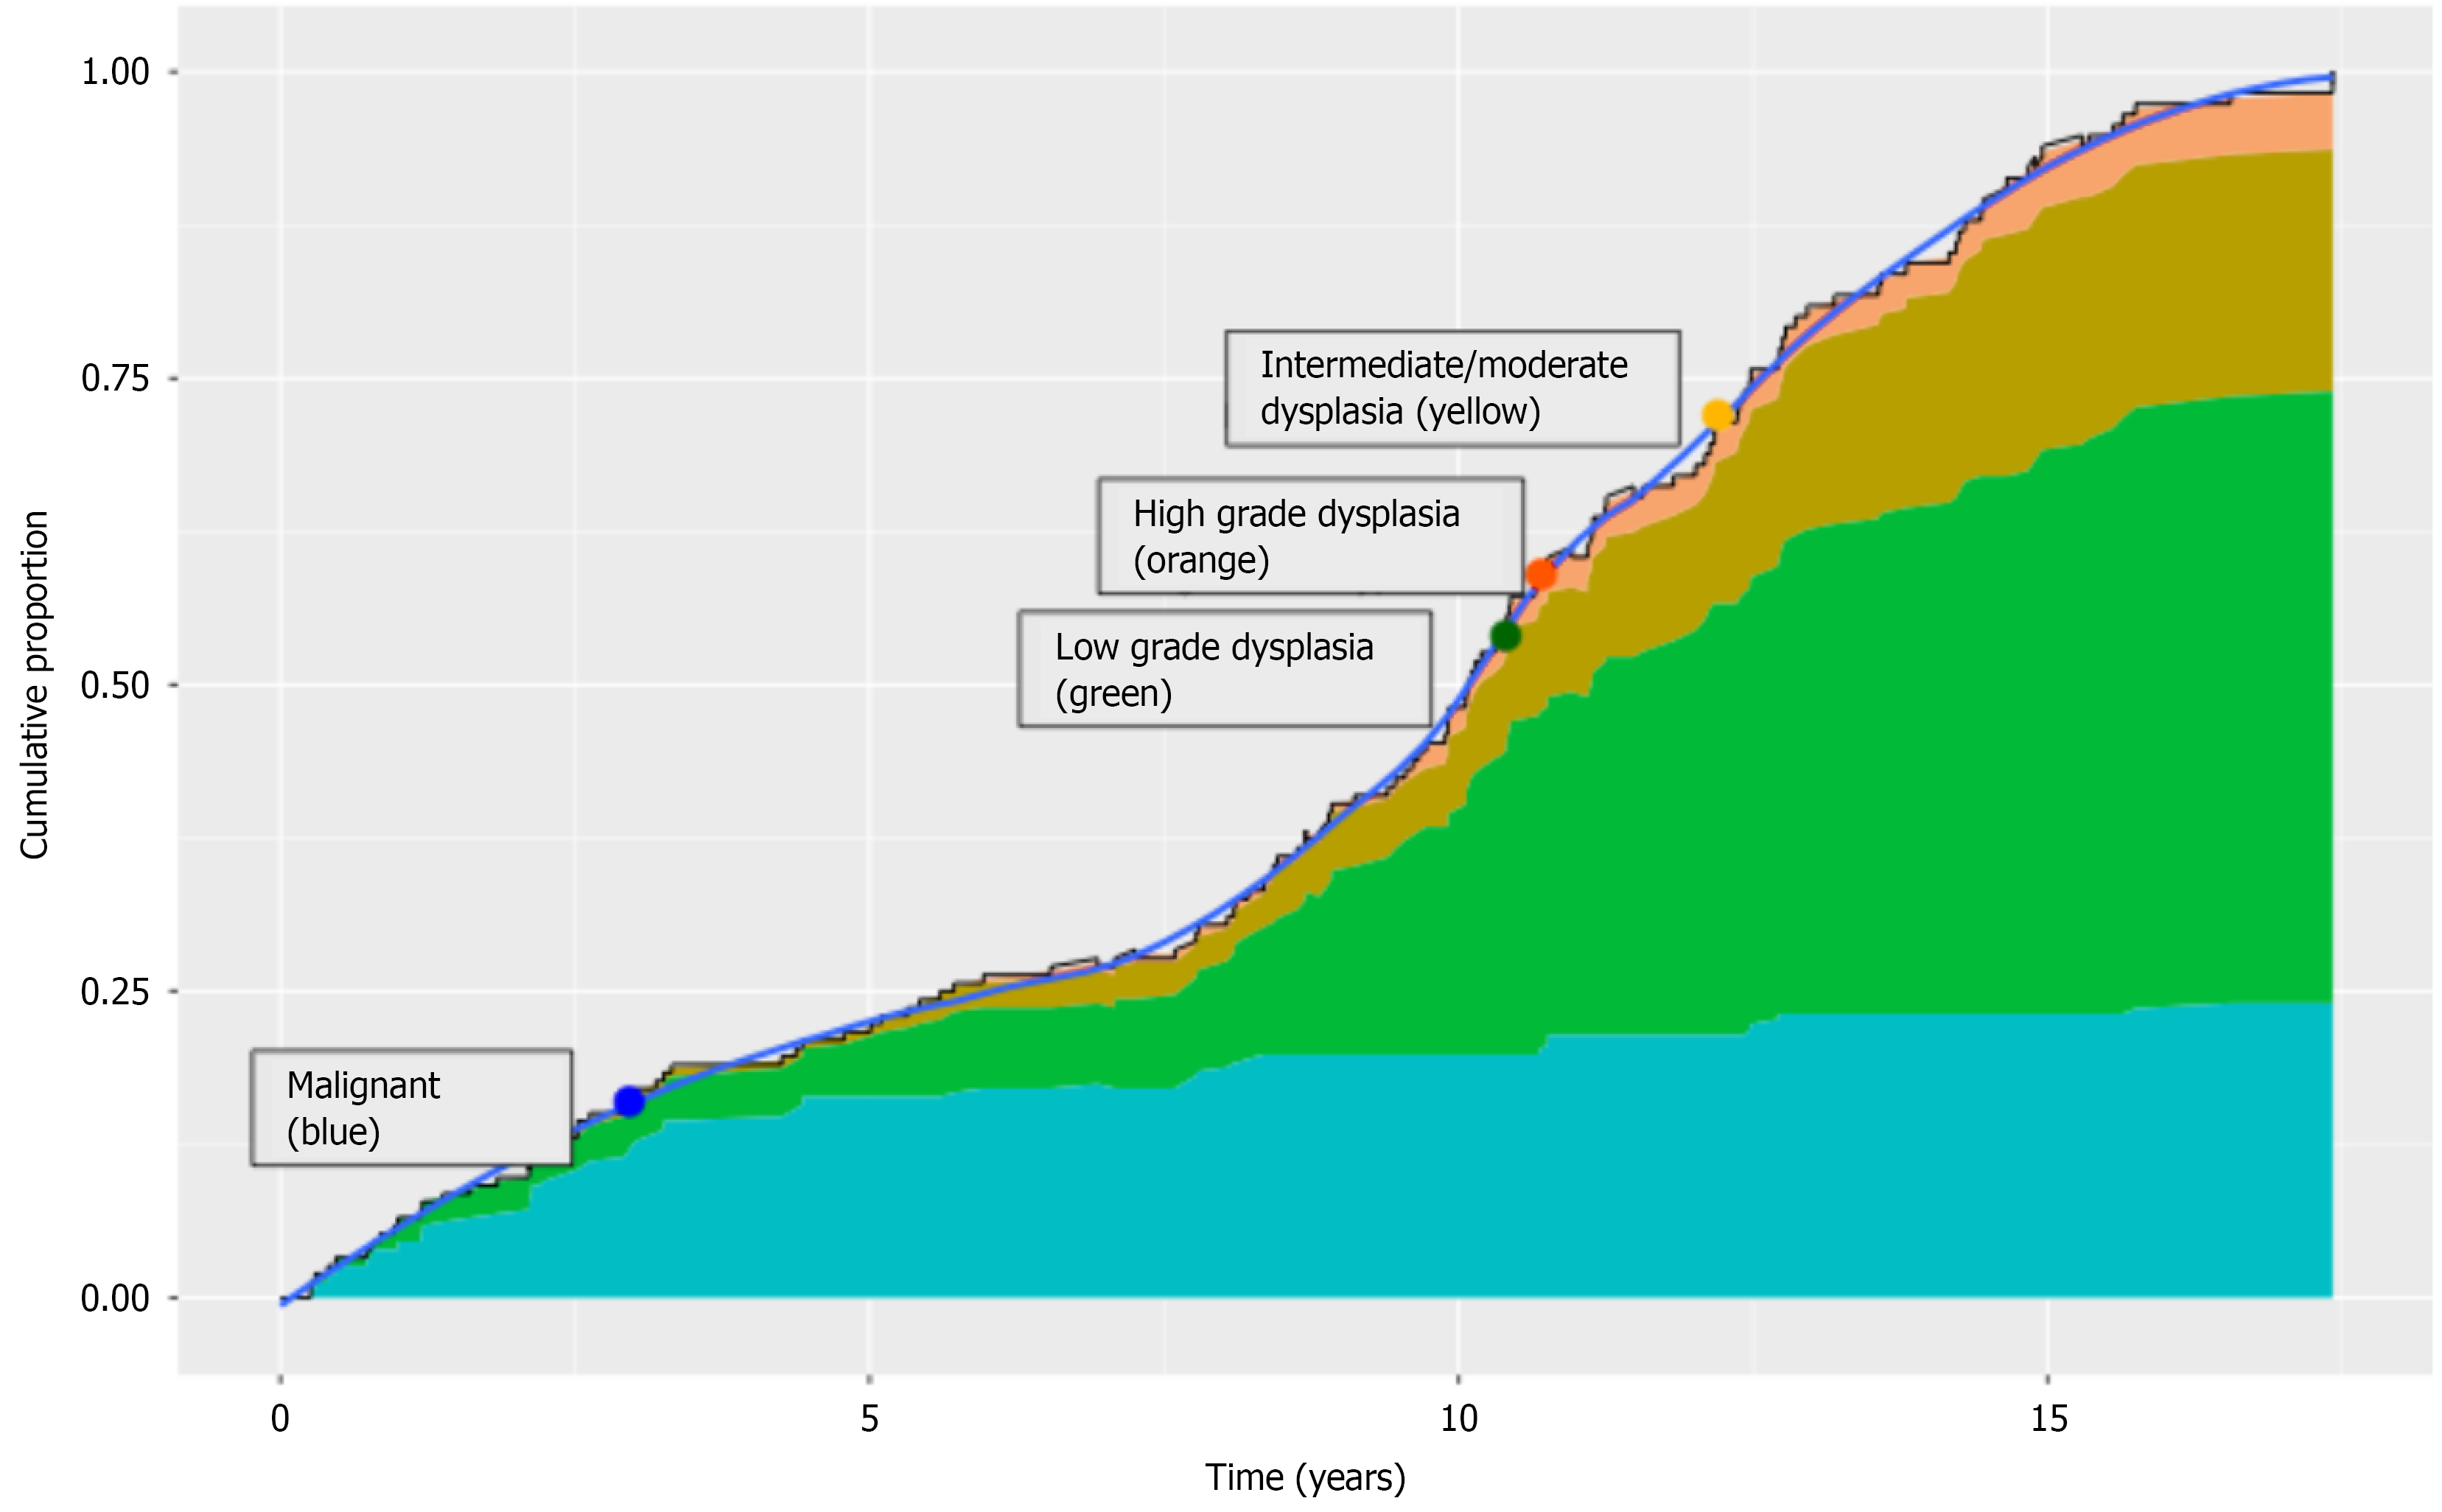
Figure 5 Stacked cumulative incidence plot.
Included are the points on the cumulative curve at which each grade of dysplasia reaches 50% of its final proportion. This gives an estimate of the average time required to observe each outcome.
- Citation: Hopley PJ, Whelan P, Jackson R, Evans J, Andrews T, Ghaneh P, Raraty M, Greenhalf W, Halloran CM. Branch duct intraductal papillary mucinous neoplasms: How ready are we to de-escalate surveillance? World J Gastroenterol 2026; 32(19): 115852
- URL: https://www.wjgnet.com/1007-9327/full/v32/i19/115852.htm
- DOI: https://dx.doi.org/10.3748/wjg.v32.i19.115852