
















Copyright: ©Author(s) 2026.
World J Gastroenterol. May 21, 2026; 32(19): 113022
Published online May 21, 2026. doi: 10.3748/wjg.v32.i19.113022
Published online May 21, 2026. doi: 10.3748/wjg.v32.i19.113022
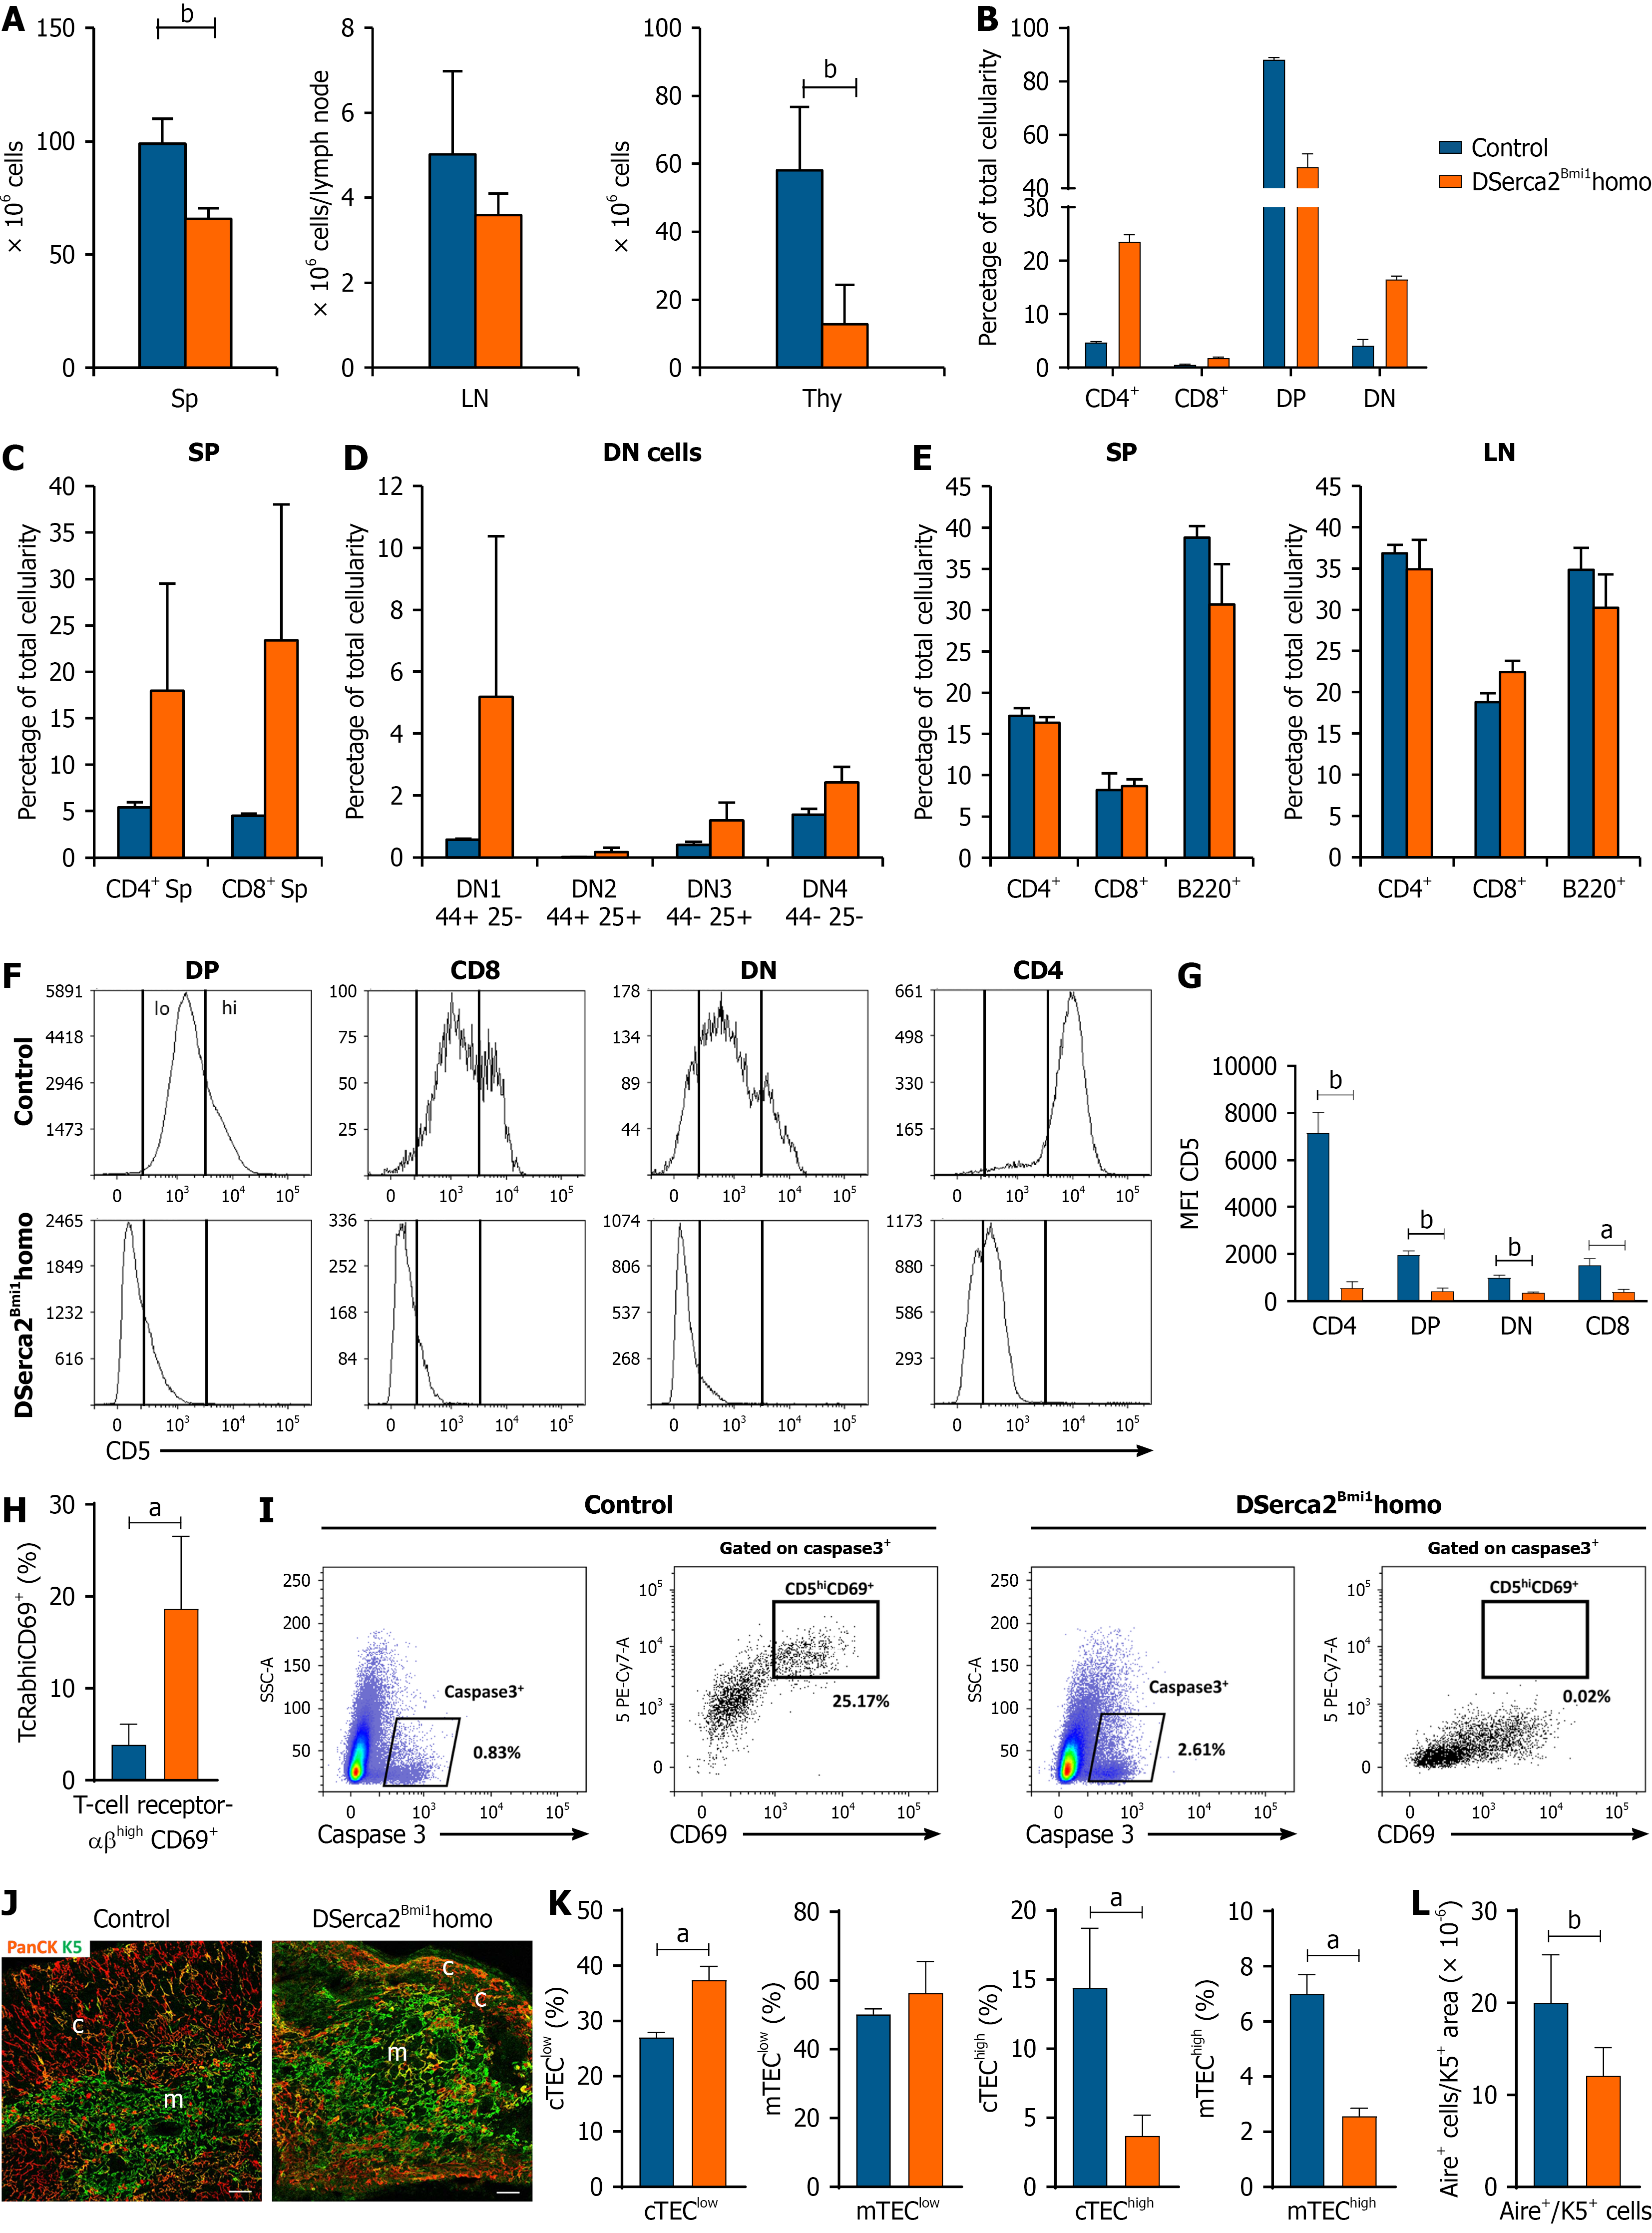
Figure 6 Impact of Serca2 conditional gene deletion in the lymphohematopoietic adult Bmi1+ cell lineages.
A: Total cellularity in spleen (Sp), lymph nodes (LN) and thymus (Thy) of DSerca2Bmi1homo [10 days post-tamoxifen (Tx) induction] (orange bars in all analyses) and control mice (blue bars in all analyses); B-D: Flow cytometry analysis of different thymic subpopulations including single-positive (SP) [cluster of differentiation 4 (CD4+) or 8 (CD8+)], double-positive (DP) (CD4+ CD8+) and double-negative (DN) (CD4- CD8-); B: Percental representation of SP, DP and DN populations; C: Percental representation of SP/DN ratios; D: Percental representation of DN subpopulations; E: Evaluation of T (CD4+ or CD8+) and B (B220+) cells in Sp and LN (n = 3 each; independent animals); F and G: Representative histograms (F) and mean fluorescence intensity (G) of CD5 expression in DP, SP and DN thymocyte subsets; notice the absence of CD5high and reduced CD5low cells in DSerca2Bmi1homo Thy compared with controls. All comparisons were carried out in DSerca2Bmi1homo (10 days post-Tx) compared with control mice (n = 3 each; independent animals); H: Proportions of total thymic T-cell receptor-αβhigh CD69+ positive selected cells; I: Gated dot plots for evaluating negatively selected thymocytes (Caspase3+ CD5high CD69+) in both control and DSerca2Bmi1homo thymuses; J: Thy histology of both control and DSerca2Bmi1homo mice using an anti-pan cytokeratin (PanCK) marker for detecting cortical and anti-keratin 5 (K5) cytokeratin mAb for medullary epithelium; note the reduced cortical area and the enlarged medullary compartment in DSerca2Bmi1 Thy compared with controls. Scale bar: 50 μm; K: Proportions of different thymic epithelial cells (TEC) subsets defined by the expression of major histocompatibility complex (MHC) II and ulex europaeus agglutinin (UEA)-1 cells markers in the total TEC (epithelial cell adhesion molecule+ CD45-): Cortical TEClow (UEA-1- MHCIIlow), medullary TEClow (UEA-1+ MHCIIlow), cortical TEChigh (UEA-1- MHCIIhigh) and medullary TEChigh (UEA-1+ MHCIIhigh). Animals used for F-I and K were n = 3, controls; n = 2, DSerca2Bmi1homo; age-matched animals; L: Numbers of Aire+ cells respect to K5+ area in thymic sections of DSerca2Bmi1homo thymuses compared with controls ones (n = 2 each; age-matched animals). Data are expressed as mean ± SD. aP < 0.05. bP < 0.02. TEC: Thymic epithelial cell; Sp: Spleen; LN: Lymph nodes; Thy: Thymus; CD: Cluster of differentiation; DN: Double-negative; DP: Double-positive; TcR: T-cell receptor; K5: Keratin 5; PanCK: Pan cytokeratin; mTEC: Medullary thymic epithelial cell; cTEC: Cortical thymic epithelial cell.
- Citation: Herrero D, Docavo A, Salvador M, Higuera M, Cortés A, García-Ceca J, Montero-Herradón S, García-Brenes MA, Albericio G, Cordero A, Carmona RM, de Molina A, Salvador JM, Mora C, Zapata AG, Bernad A. Serca2 deletion in the mouse adult Bmi1+ compartment induces a lethal phenotype involving a severe gastric dysfunction. World J Gastroenterol 2026; 32(19): 113022
- URL: https://www.wjgnet.com/1007-9327/full/v32/i19/113022.htm
- DOI: https://dx.doi.org/10.3748/wjg.v32.i19.113022