
















Copyright: ©Author(s) 2026.
World J Gastroenterol. May 14, 2026; 32(18): 118267
Published online May 14, 2026. doi: 10.3748/wjg.v32.i18.118267
Published online May 14, 2026. doi: 10.3748/wjg.v32.i18.118267
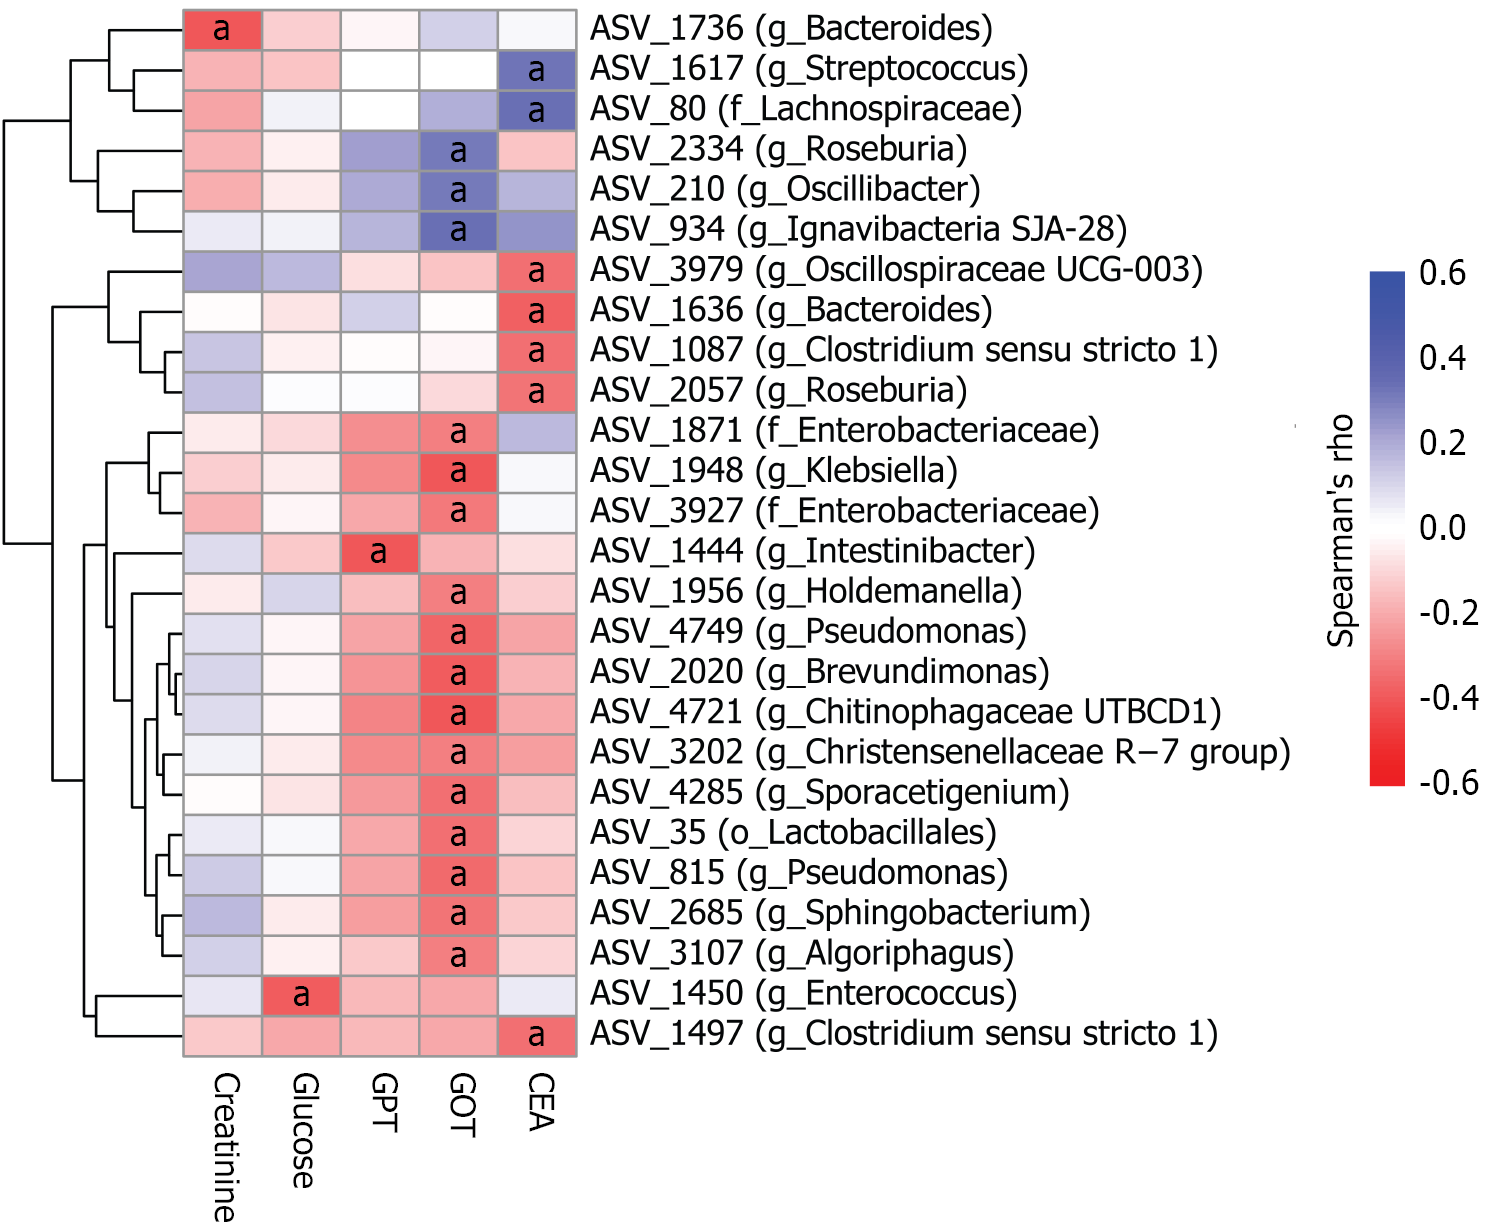
Figure 4 Heatmap showing the Spearman’s rank correlations between amplicon sequence variant abundance and serum biochemical markers.
Spearman’s ρ values were computed for each amplicon sequence variant (ASV) in relation to each biochemical marker. Multiple testing was adjusted using the Benjamini-Hochberg method, and only ASVs or markers with adjusted P values < 0.05 are displayed. Hierarchical clustering of ASVs was performed using the Euclidean distance metric. aAdjusted P < 0.05. ASVs were labeled with genus (g_), or family (f_), or order (o_) when the genus-level classification was unavailable. ASV: Amplicon sequence variant; GOT: Glutamic oxaloacetic transaminase; GPT: Glutamic pyruvic transaminase; CEA: Carcinoembryonic antigen.
- Citation: Le HTT, Le HX, Huyen DT, Tran TA, Quyen DV, Song LH, Tran TV, Thas O, Nhung PTT, Tran TTT. Longitudinal changes in the gut microbiota of Vietnamese patients with colorectal cancer undergoing surgery and chemotherapy. World J Gastroenterol 2026; 32(18): 118267
- URL: https://www.wjgnet.com/1007-9327/full/v32/i18/118267.htm
- DOI: https://dx.doi.org/10.3748/wjg.v32.i18.118267