











Copyright: ©Author(s) 2026.
World J Gastroenterol. May 14, 2026; 32(18): 118267
Published online May 14, 2026. doi: 10.3748/wjg.v32.i18.118267
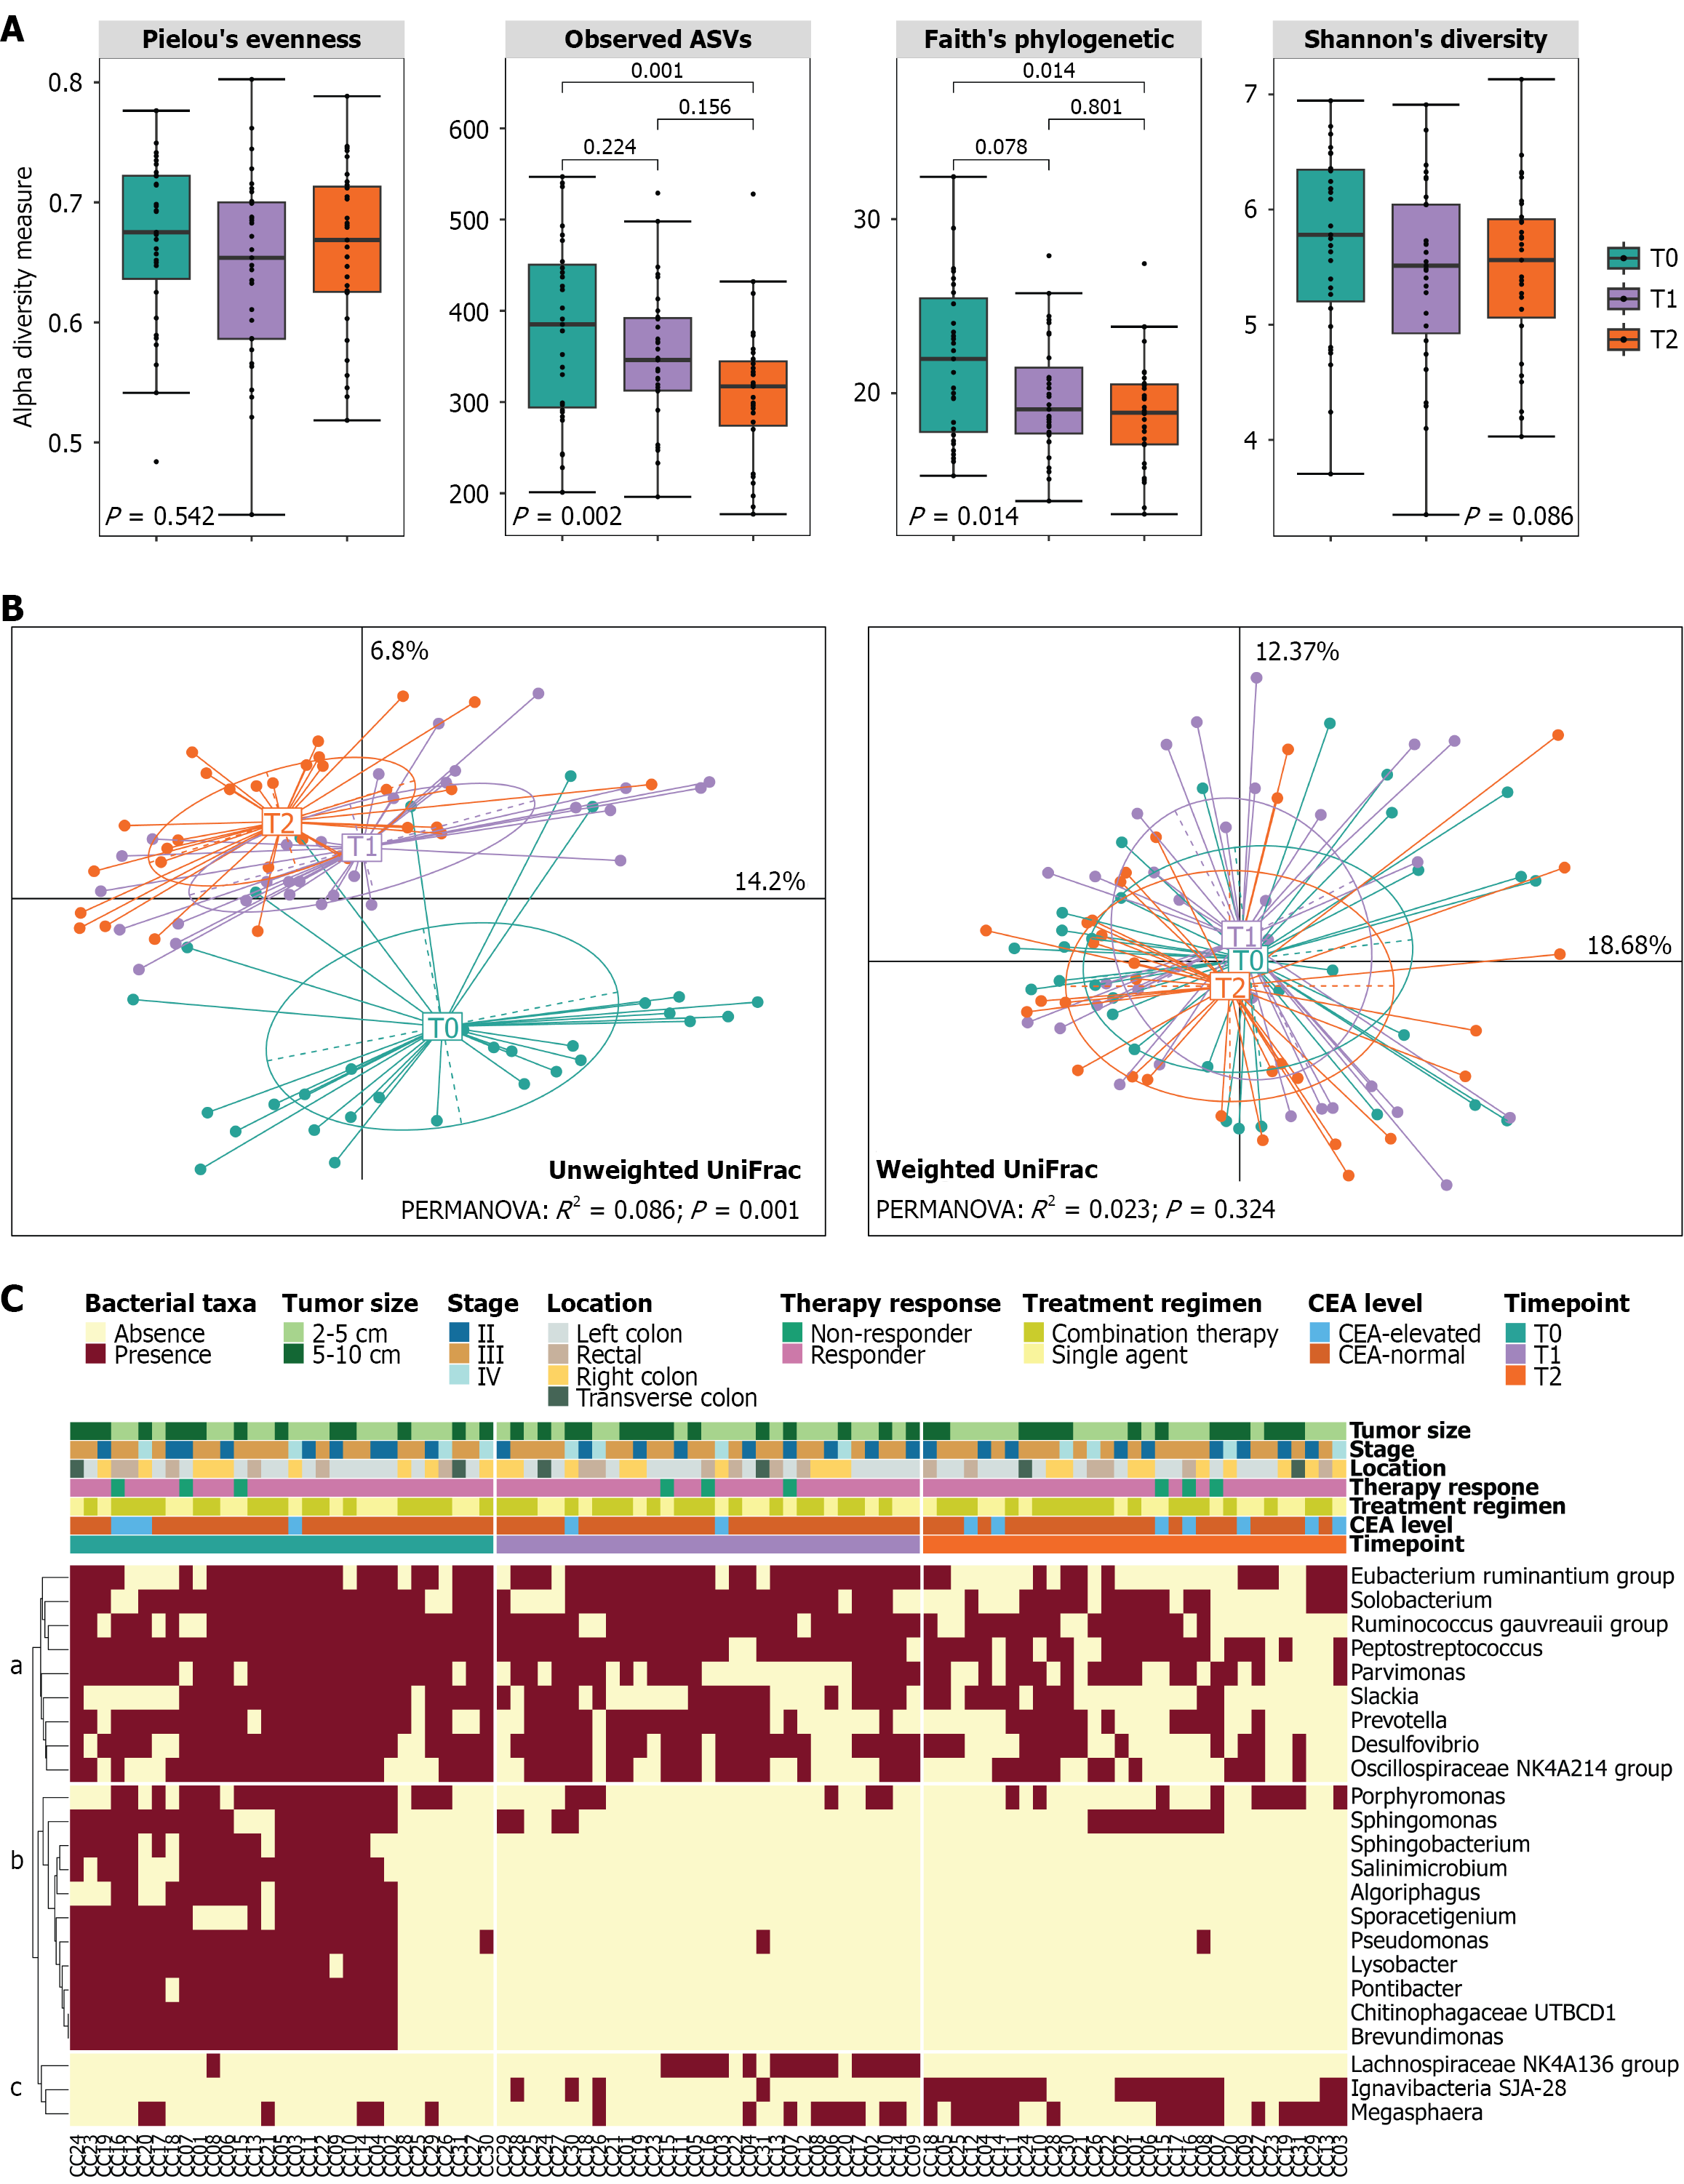
Figure 1 Microbial diversity of the gut microbiota in patients with colorectal cancer at diagnosis (T0), after surgery (T1), and after che motherapy (T2).
A: Boxplots showing the Pielou’s evenness, observed amplicon sequence variants, Faith’s phylogenetic diversity, and Shannon’s diversity alpha diversity indices. P values were calculated with the Friedman test, and the Nemenyi test for pairwise comparisons when the Friedman test was significant; B: Principal coordinates analysis based on the unweighted and weighted UniFrac distances. Differences in beta diversity between timepoints were assessed using permutational multivariate analysis of variance; C: Heatmap showing the presence (red) and absence (light yellow) of gut microbiota genera. Only classified genera with significant differences across the three timepoints (Benjamini-Hochberg-adjusted P value < 0.05, Cochran’s Q test) are displayed. Clustering of genera on the left side of the heatmap was performed using Euclidean distances and Ward’s hierarchical algorithm, resulting in three major clusters (a, b, and c) based on their presence across samples. Colored bars at the top of the heatmap represent tumor size, tumor, node and metastasis stage, location, therapy response, treatment regimen, carcinoembryonic antigen concentration, and timepoint.
- Citation: Le HTT, Le HX, Huyen DT, Tran TA, Quyen DV, Song LH, Tran TV, Thas O, Nhung PTT, Tran TTT. Longitudinal changes in the gut microbiota of Vietnamese patients with colorectal cancer undergoing surgery and chemotherapy. World J Gastroenterol 2026; 32(18): 118267
- URL: https://www.wjgnet.com/1007-9327/full/v32/i18/118267.htm
- DOI: https://dx.doi.org/10.3748/wjg.v32.i18.118267