
















Copyright: ©Author(s) 2026.
World J Gastroenterol. May 14, 2026; 32(18): 114713
Published online May 14, 2026. doi: 10.3748/wjg.v32.i18.114713
Published online May 14, 2026. doi: 10.3748/wjg.v32.i18.114713
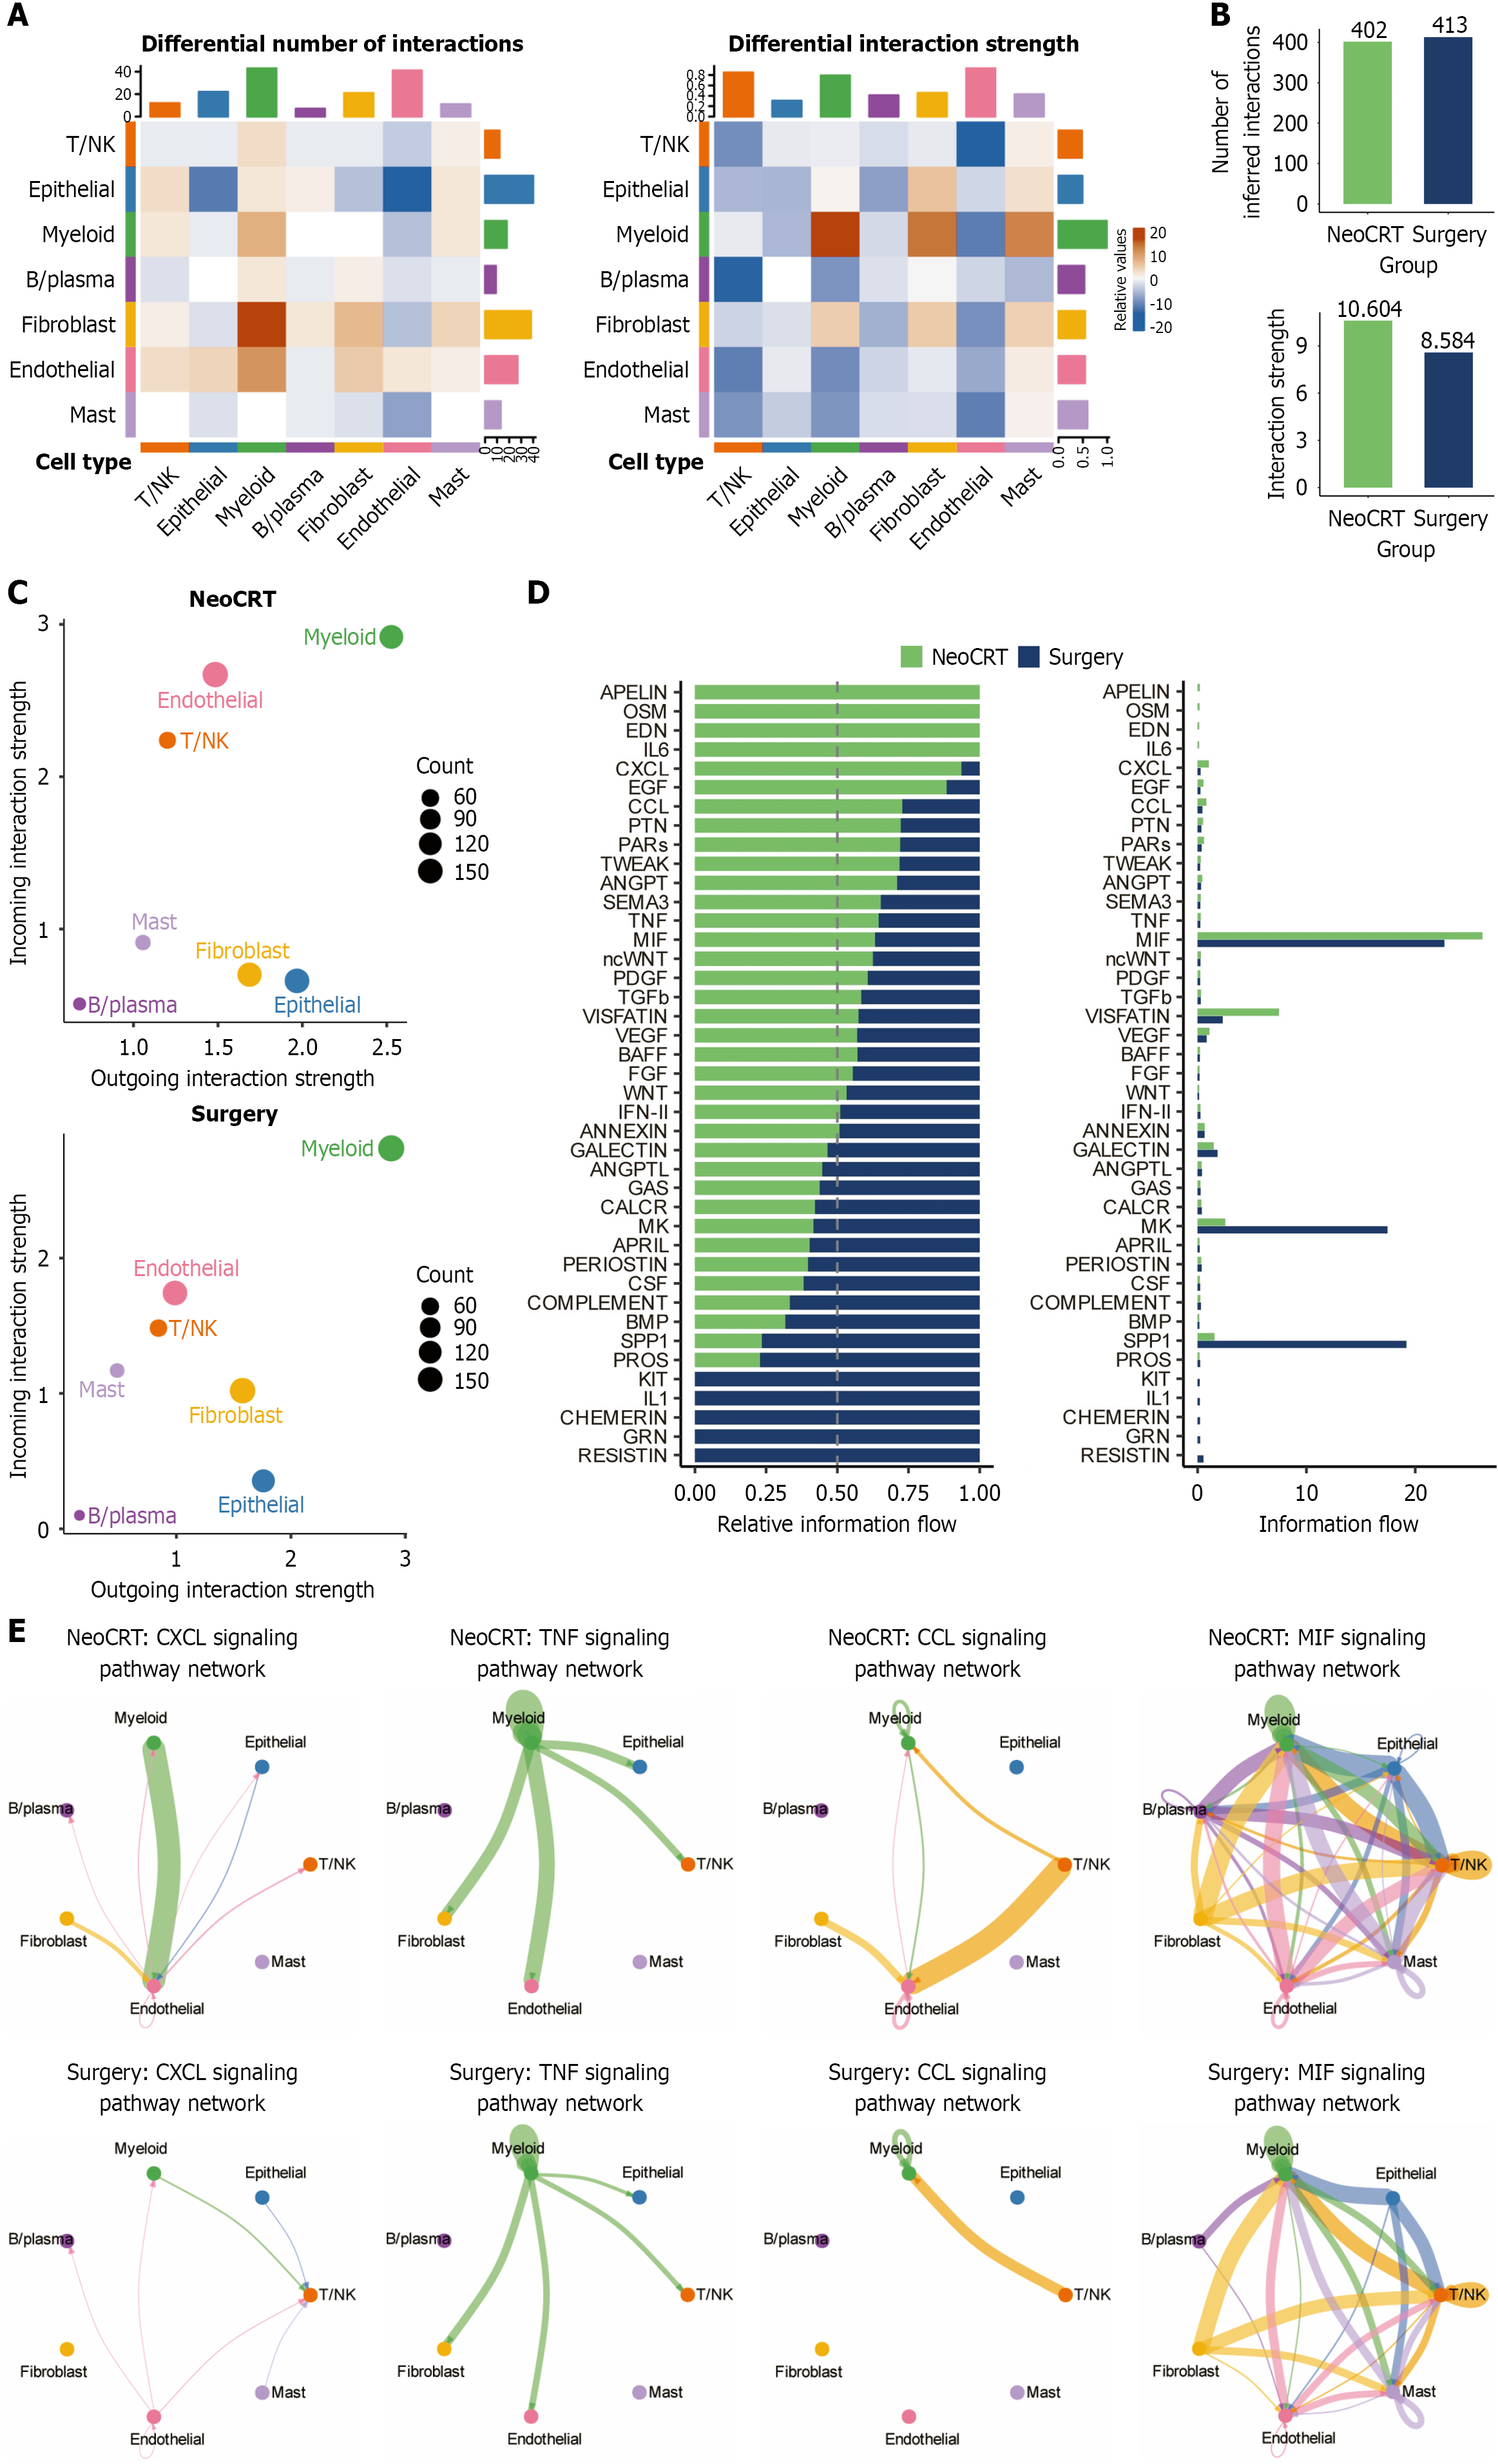
Figure 2 Cellchat analysis demonstrates neoadjuvant chemoradiotherapy-mediated development of a pro-inflammatory microen
- Citation: Yan QH, Xu CD, Li ZG, Zheng YZ, Wong WS, Liang DC, Yang J, Chang WG, Wang JY. LGALS1 drives chemoresistance in esophageal squamous cell carcinoma by modulating epithelial-mesenchymal transition and tumor immunity. World J Gastroenterol 2026; 32(18): 114713
- URL: https://www.wjgnet.com/1007-9327/full/v32/i18/114713.htm
- DOI: https://dx.doi.org/10.3748/wjg.v32.i18.114713