
















Copyright: ©Author(s) 2026.
World J Gastroenterol. May 14, 2026; 32(18): 114713
Published online May 14, 2026. doi: 10.3748/wjg.v32.i18.114713
Published online May 14, 2026. doi: 10.3748/wjg.v32.i18.114713
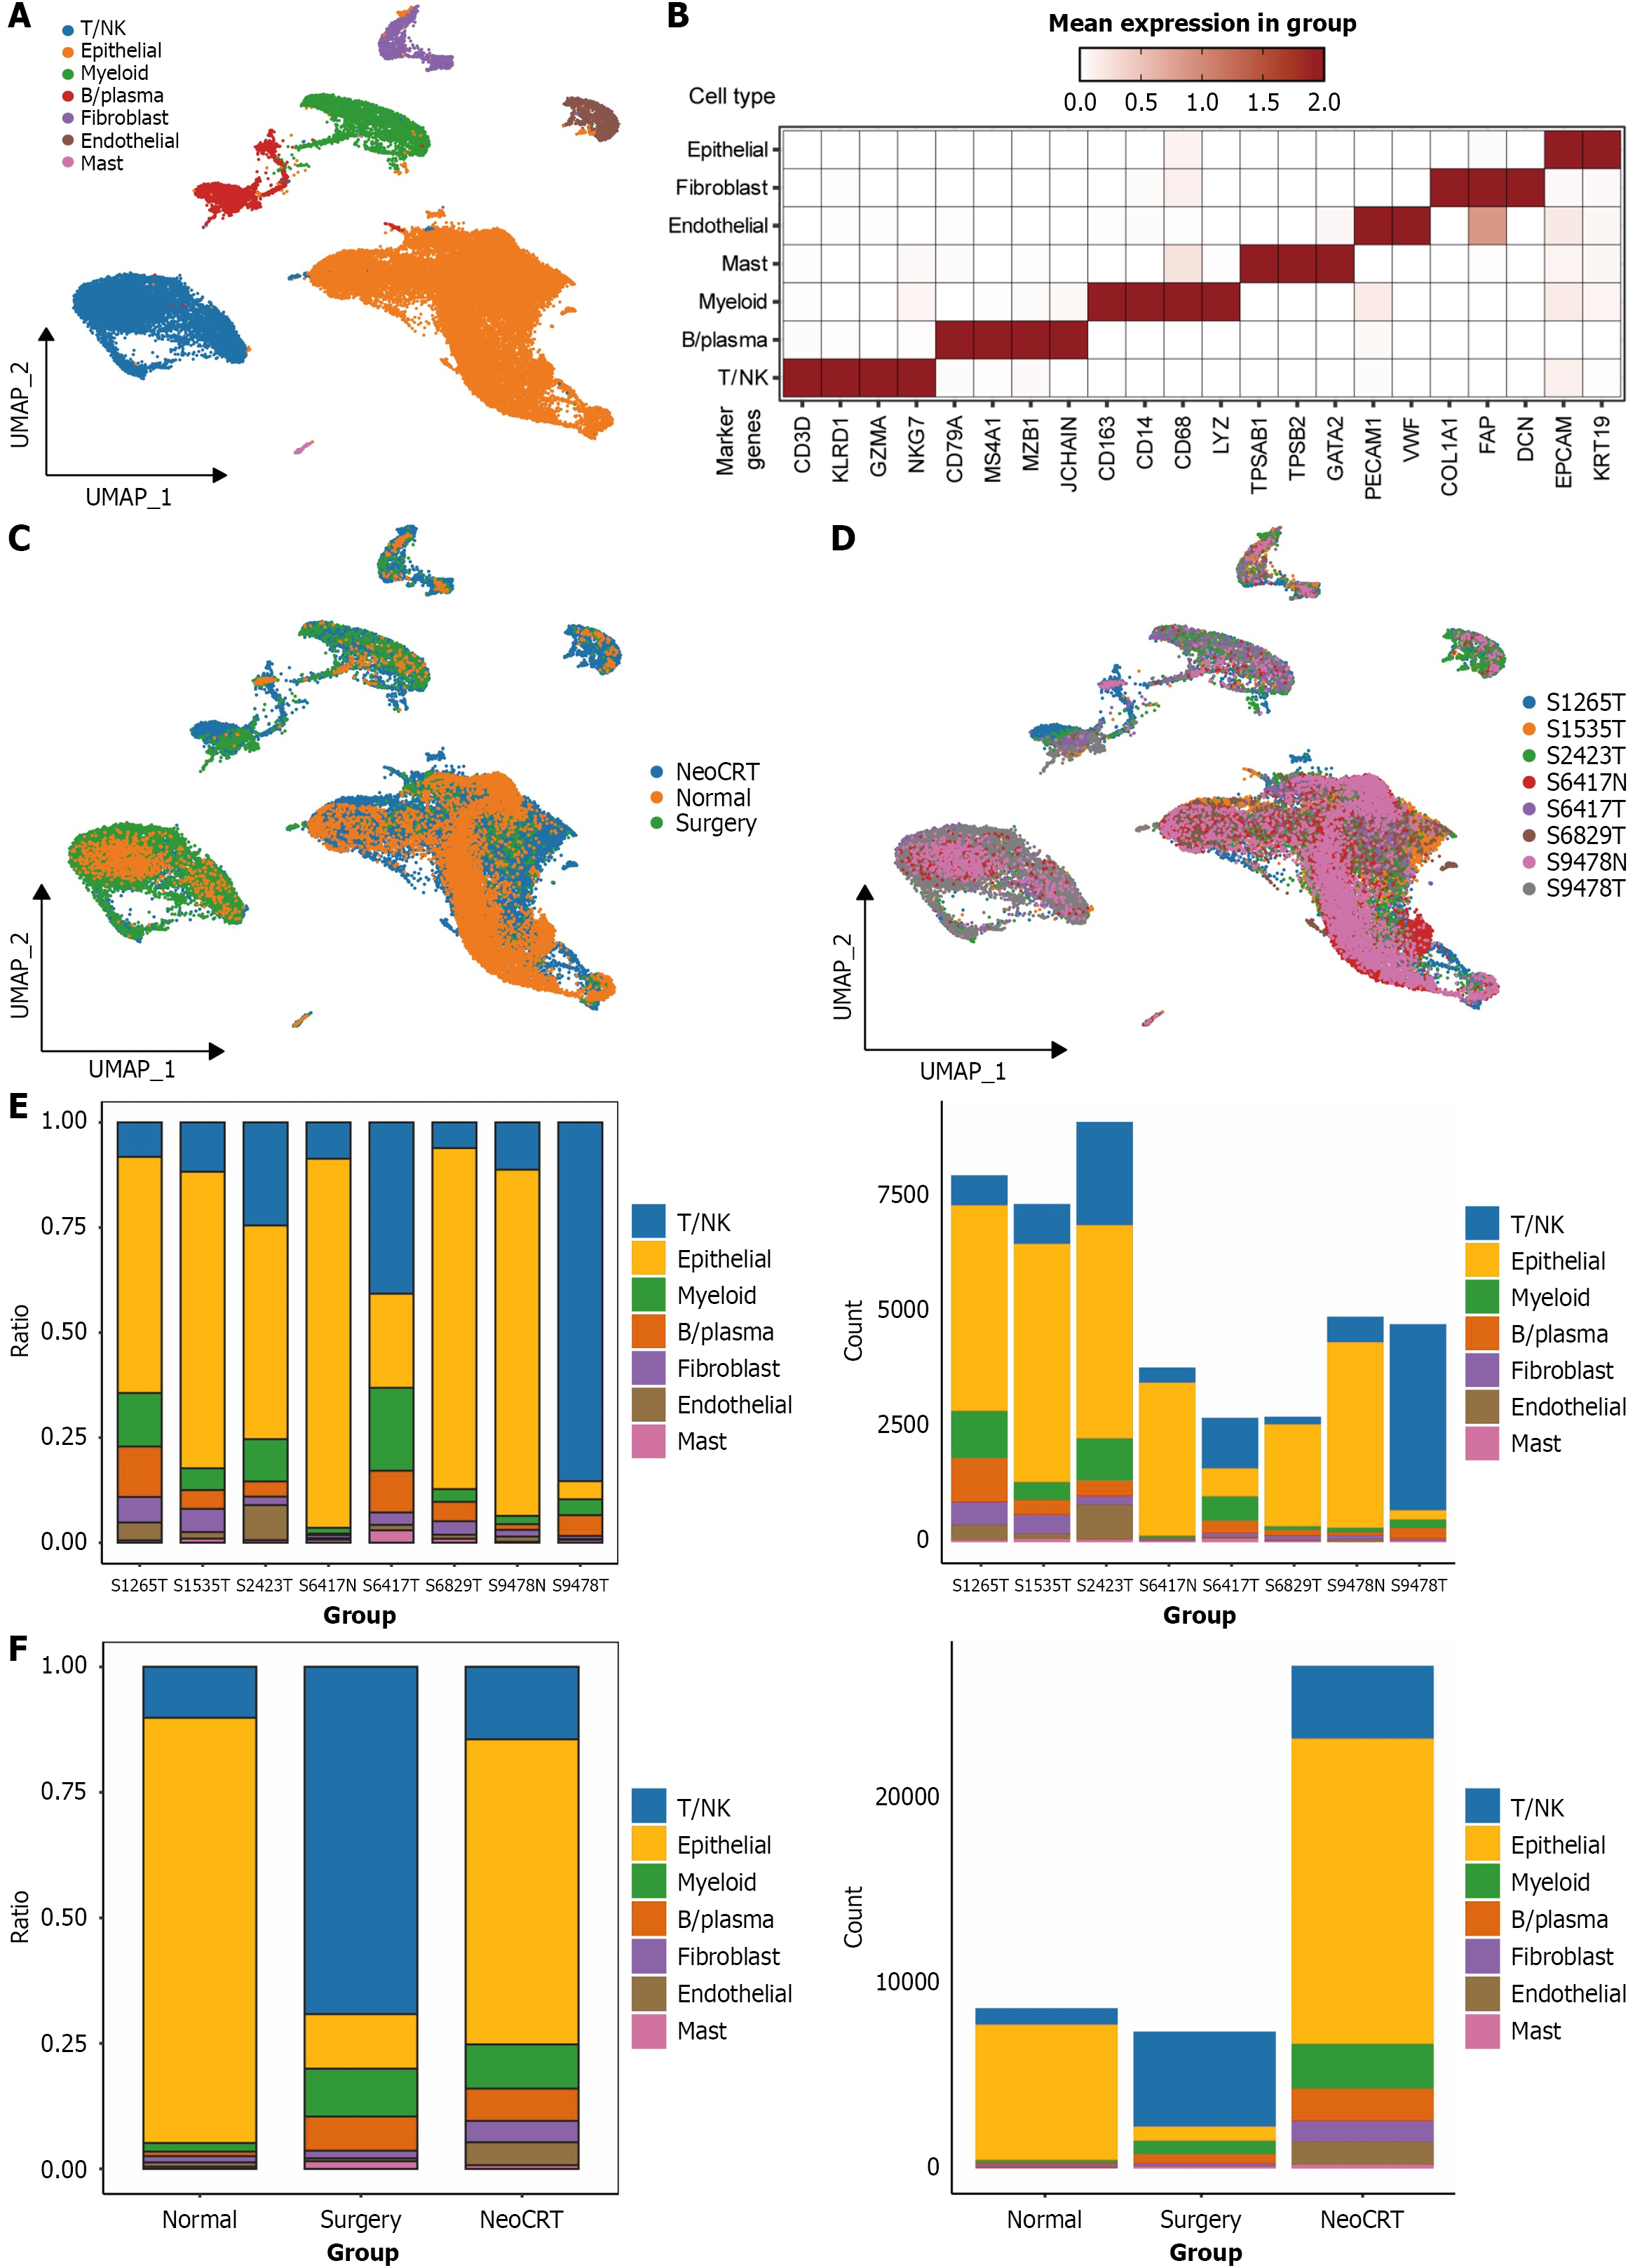
Figure 1 Comprehensive analysis of single-cell subpopulations in esophageal squamous cell carcinoma patients receiving neoadjuvant chemoradiotherapy and surgical treatment.
A: UMAP visualization of 43407 high-quality cells across all 7 cellular types; B: Marker genes for distinct cell types, with coloring based on Z-score normalized expression levels; C: UMAP visualization of all cells derived from normal tissue, surgical and neoadjuvant chemoradiotherapy groups; D: UMAP visualization of all cells obtained from 8 samples; E: Distribution and quantities of distinct cell types across 8 specimens; F: Distribution and quantities of distinct cell types within the 3 groups. NeoCRT: Neoadjuvant chemoradiotherapy; NK: Natural killer.
- Citation: Yan QH, Xu CD, Li ZG, Zheng YZ, Wong WS, Liang DC, Yang J, Chang WG, Wang JY. LGALS1 drives chemoresistance in esophageal squamous cell carcinoma by modulating epithelial-mesenchymal transition and tumor immunity. World J Gastroenterol 2026; 32(18): 114713
- URL: https://www.wjgnet.com/1007-9327/full/v32/i18/114713.htm
- DOI: https://dx.doi.org/10.3748/wjg.v32.i18.114713