
















Copyright: ©Author(s) 2026.
World J Gastroenterol. May 7, 2026; 32(17): 116867
Published online May 7, 2026. doi: 10.3748/wjg.v32.i17.116867
Published online May 7, 2026. doi: 10.3748/wjg.v32.i17.116867
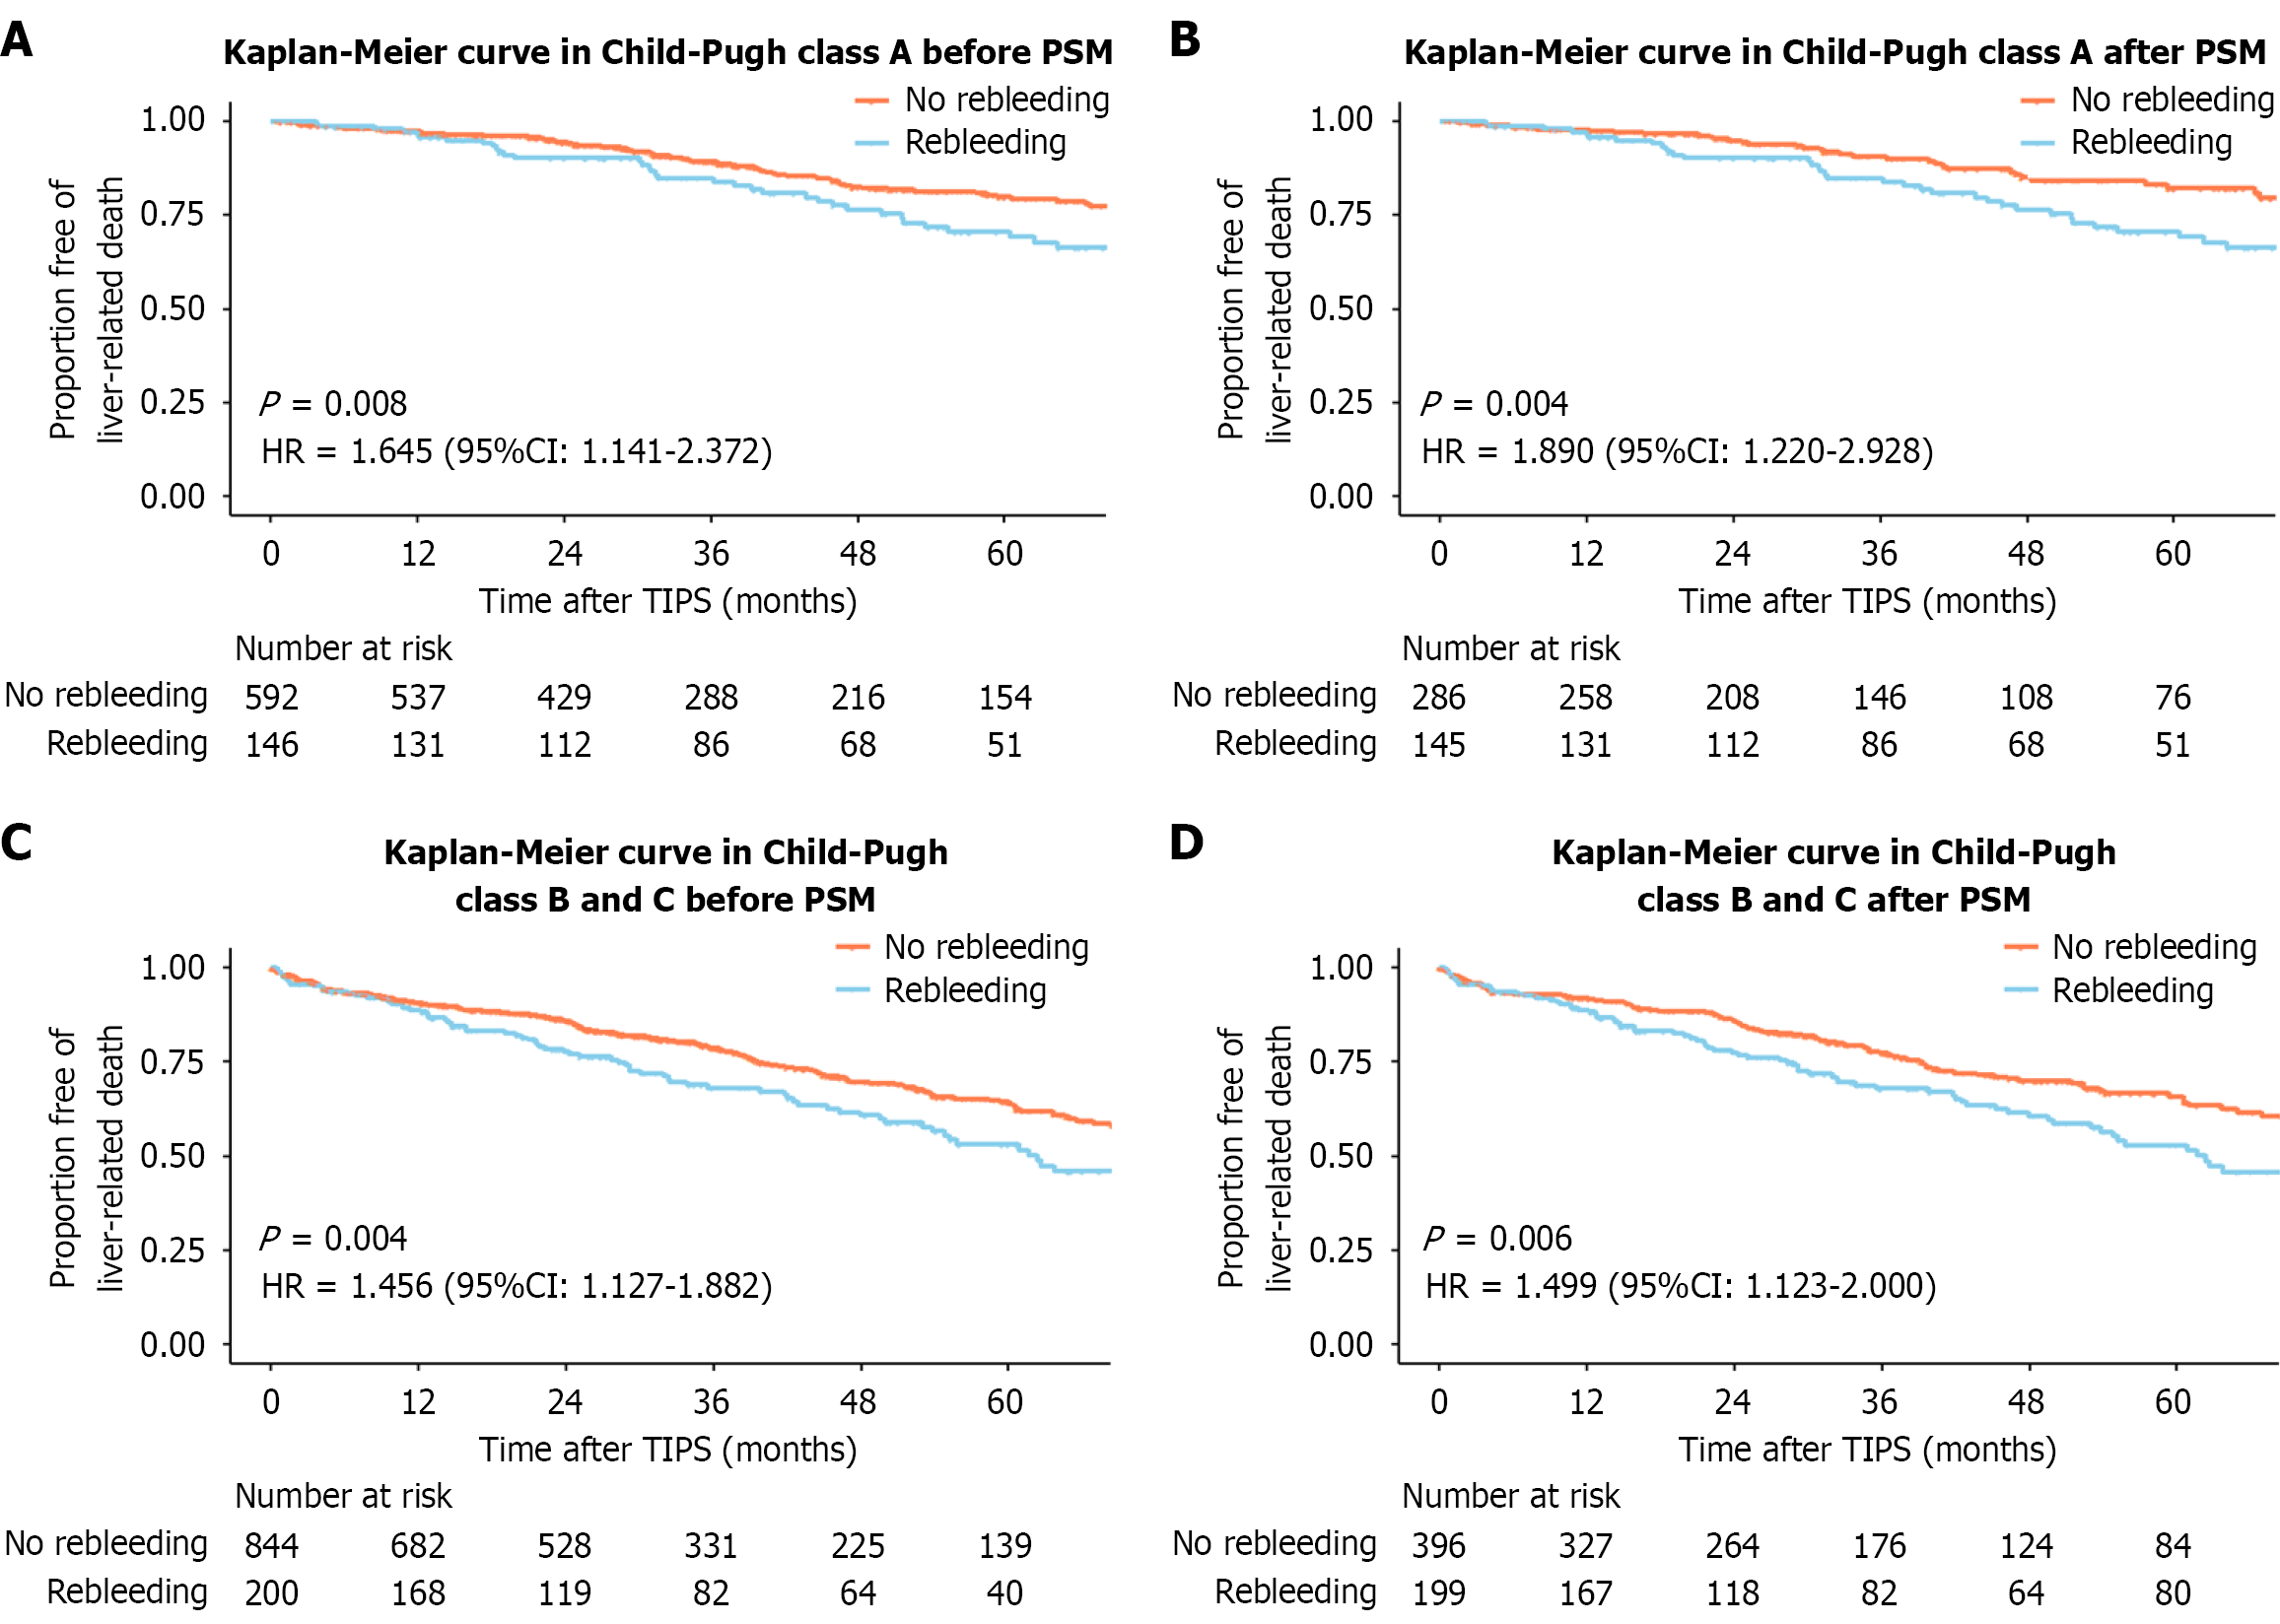
Figure 3 Subgroup analyses based on liver function.
A: Kaplan-Meier curve in Child-Pugh class A before propensity score matching (PSM); B: Kaplan-Meier curve in Child-Pugh class A after PSM; C: Kaplan-Meier curve in Child-Pugh class B/C before PSM; D: Kaplan-Meier curve in Child-Pugh class B/C after PSM. HR: Hazard ratio; PSM: Propensity score matching; TIPS: Transjugular intrahepatic portosystemic shunt; CI: Confidence interval.
- Citation: Zhu JY, Tie J, Xia YF, Wang GC, Zhuge YZ, Wu H, Zhu XL, Xue H, Xu J, Zhang F, Zhao LH, Huang GJ, Zhang MY, Li Z, Wei B, Li PJ, Wang Z, Wu W, Chen C, Tang CW, Zhang CQ. Impact of rebleeding after transjugular intrahepatic portosystemic shunt on liver-related death based on liver function categories. World J Gastroenterol 2026; 32(17): 116867
- URL: https://www.wjgnet.com/1007-9327/full/v32/i17/116867.htm
- DOI: https://dx.doi.org/10.3748/wjg.v32.i17.116867