
















Copyright: ©Author(s) 2026.
World J Gastroenterol. May 7, 2026; 32(17): 116590
Published online May 7, 2026. doi: 10.3748/wjg.v32.i17.116590
Published online May 7, 2026. doi: 10.3748/wjg.v32.i17.116590
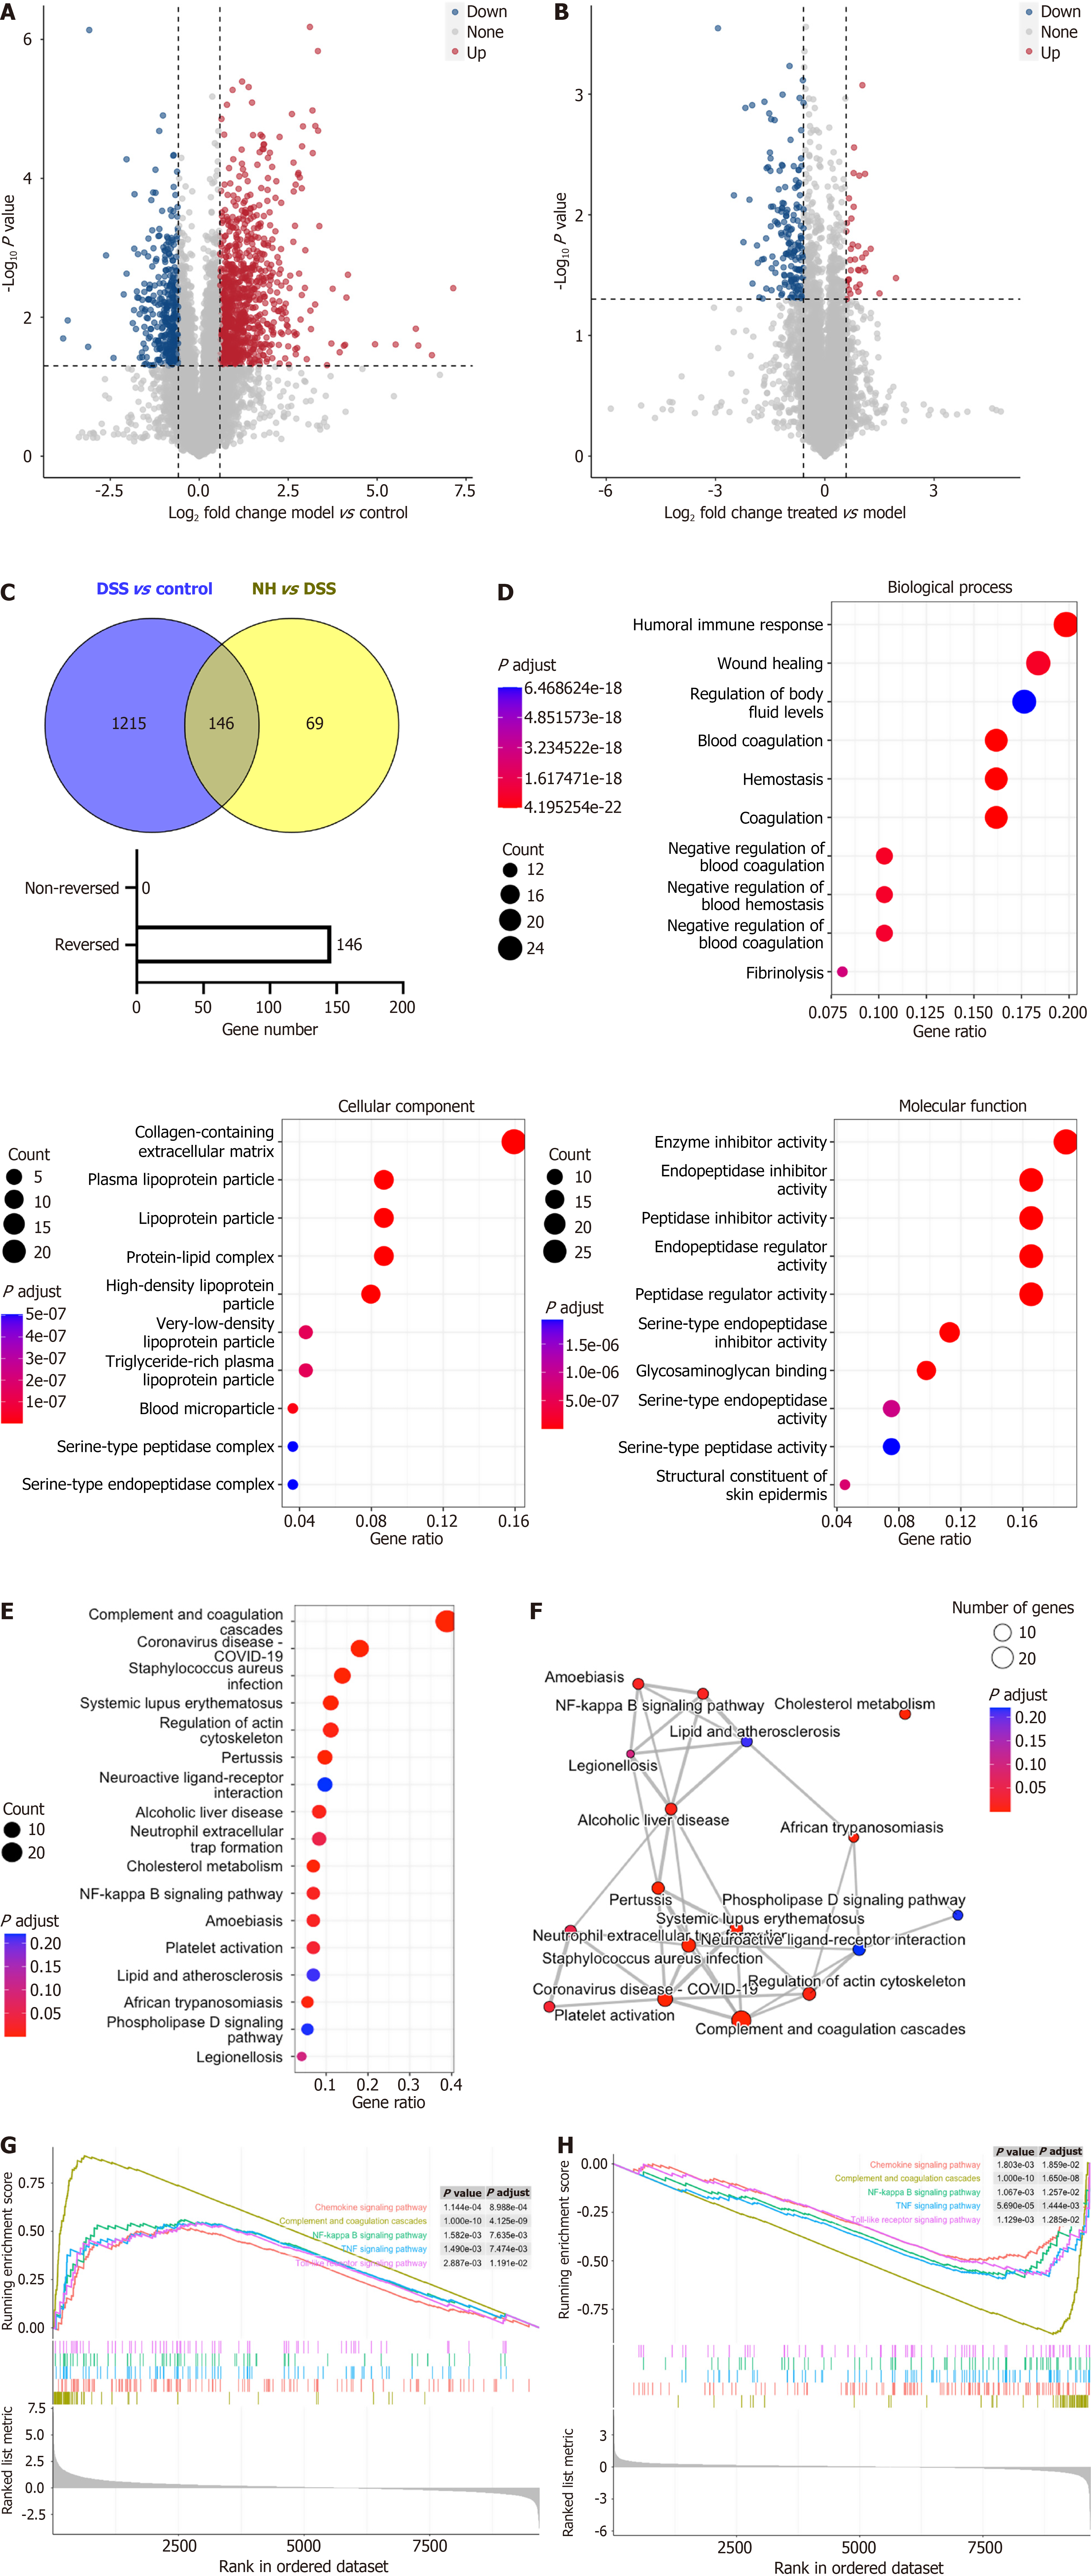
Figure 4 Transcriptomics analysis in colonic tissues.
A: Volcano plots illustrating the differentially expressed genes (DEGs) between the dextran sulfate sodium (DSS) group and control group (n = 3 in each group); B: Volcano plots illustrating the DEGs between the Niu Huang (NH) group and DSS group; C: The common genes observed in the DSS vs control and NH vs DSS groups; D: The Gene Ontology enrichment analysis of DEGs; E: The Kyoto Encyclopedia of Genes and Genomes pathways analysis of DEGs; F: Interactions network among the top 20 pathways; G: Gene set enrichment analysis showed that genes associated with the chemokine signaling pathway, complement and coagulation cascades, nuclear factor kappa B signaling pathway, tumor necrosis factor signaling pathway, and toll-like receptor signaling pathway were upregulated in the DSS group compared with that in the control group; H: Gene set enrichment analysis showed that genes associated with the chemokine signaling pathway, complement and coagulation cascades, nuclear factor kappa B signaling pathway, tumor necrosis factor signaling pathway and toll-like receptor signaling pathway were downregulated in the NH group compared with that in the DSS group. DSS: Dextran sulfate sodium; NH: Niu Huang.
- Citation: Shi J, Ma CY, Zhang XH, Liu KJ, Liu JY, Wang QG, Wang XQ, Cheng FF, Xu T. Niu Huang mitigates dextran sulfate sodium-induced colitis by modulating farnesoid X receptor activation and the complement 3/NLRP3 signaling pathway. World J Gastroenterol 2026; 32(17): 116590
- URL: https://www.wjgnet.com/1007-9327/full/v32/i17/116590.htm
- DOI: https://dx.doi.org/10.3748/wjg.v32.i17.116590