
















Copyright: ©Author(s) 2026.
World J Gastroenterol. Apr 28, 2026; 32(16): 116187
Published online Apr 28, 2026. doi: 10.3748/wjg.v32.i16.116187
Published online Apr 28, 2026. doi: 10.3748/wjg.v32.i16.116187
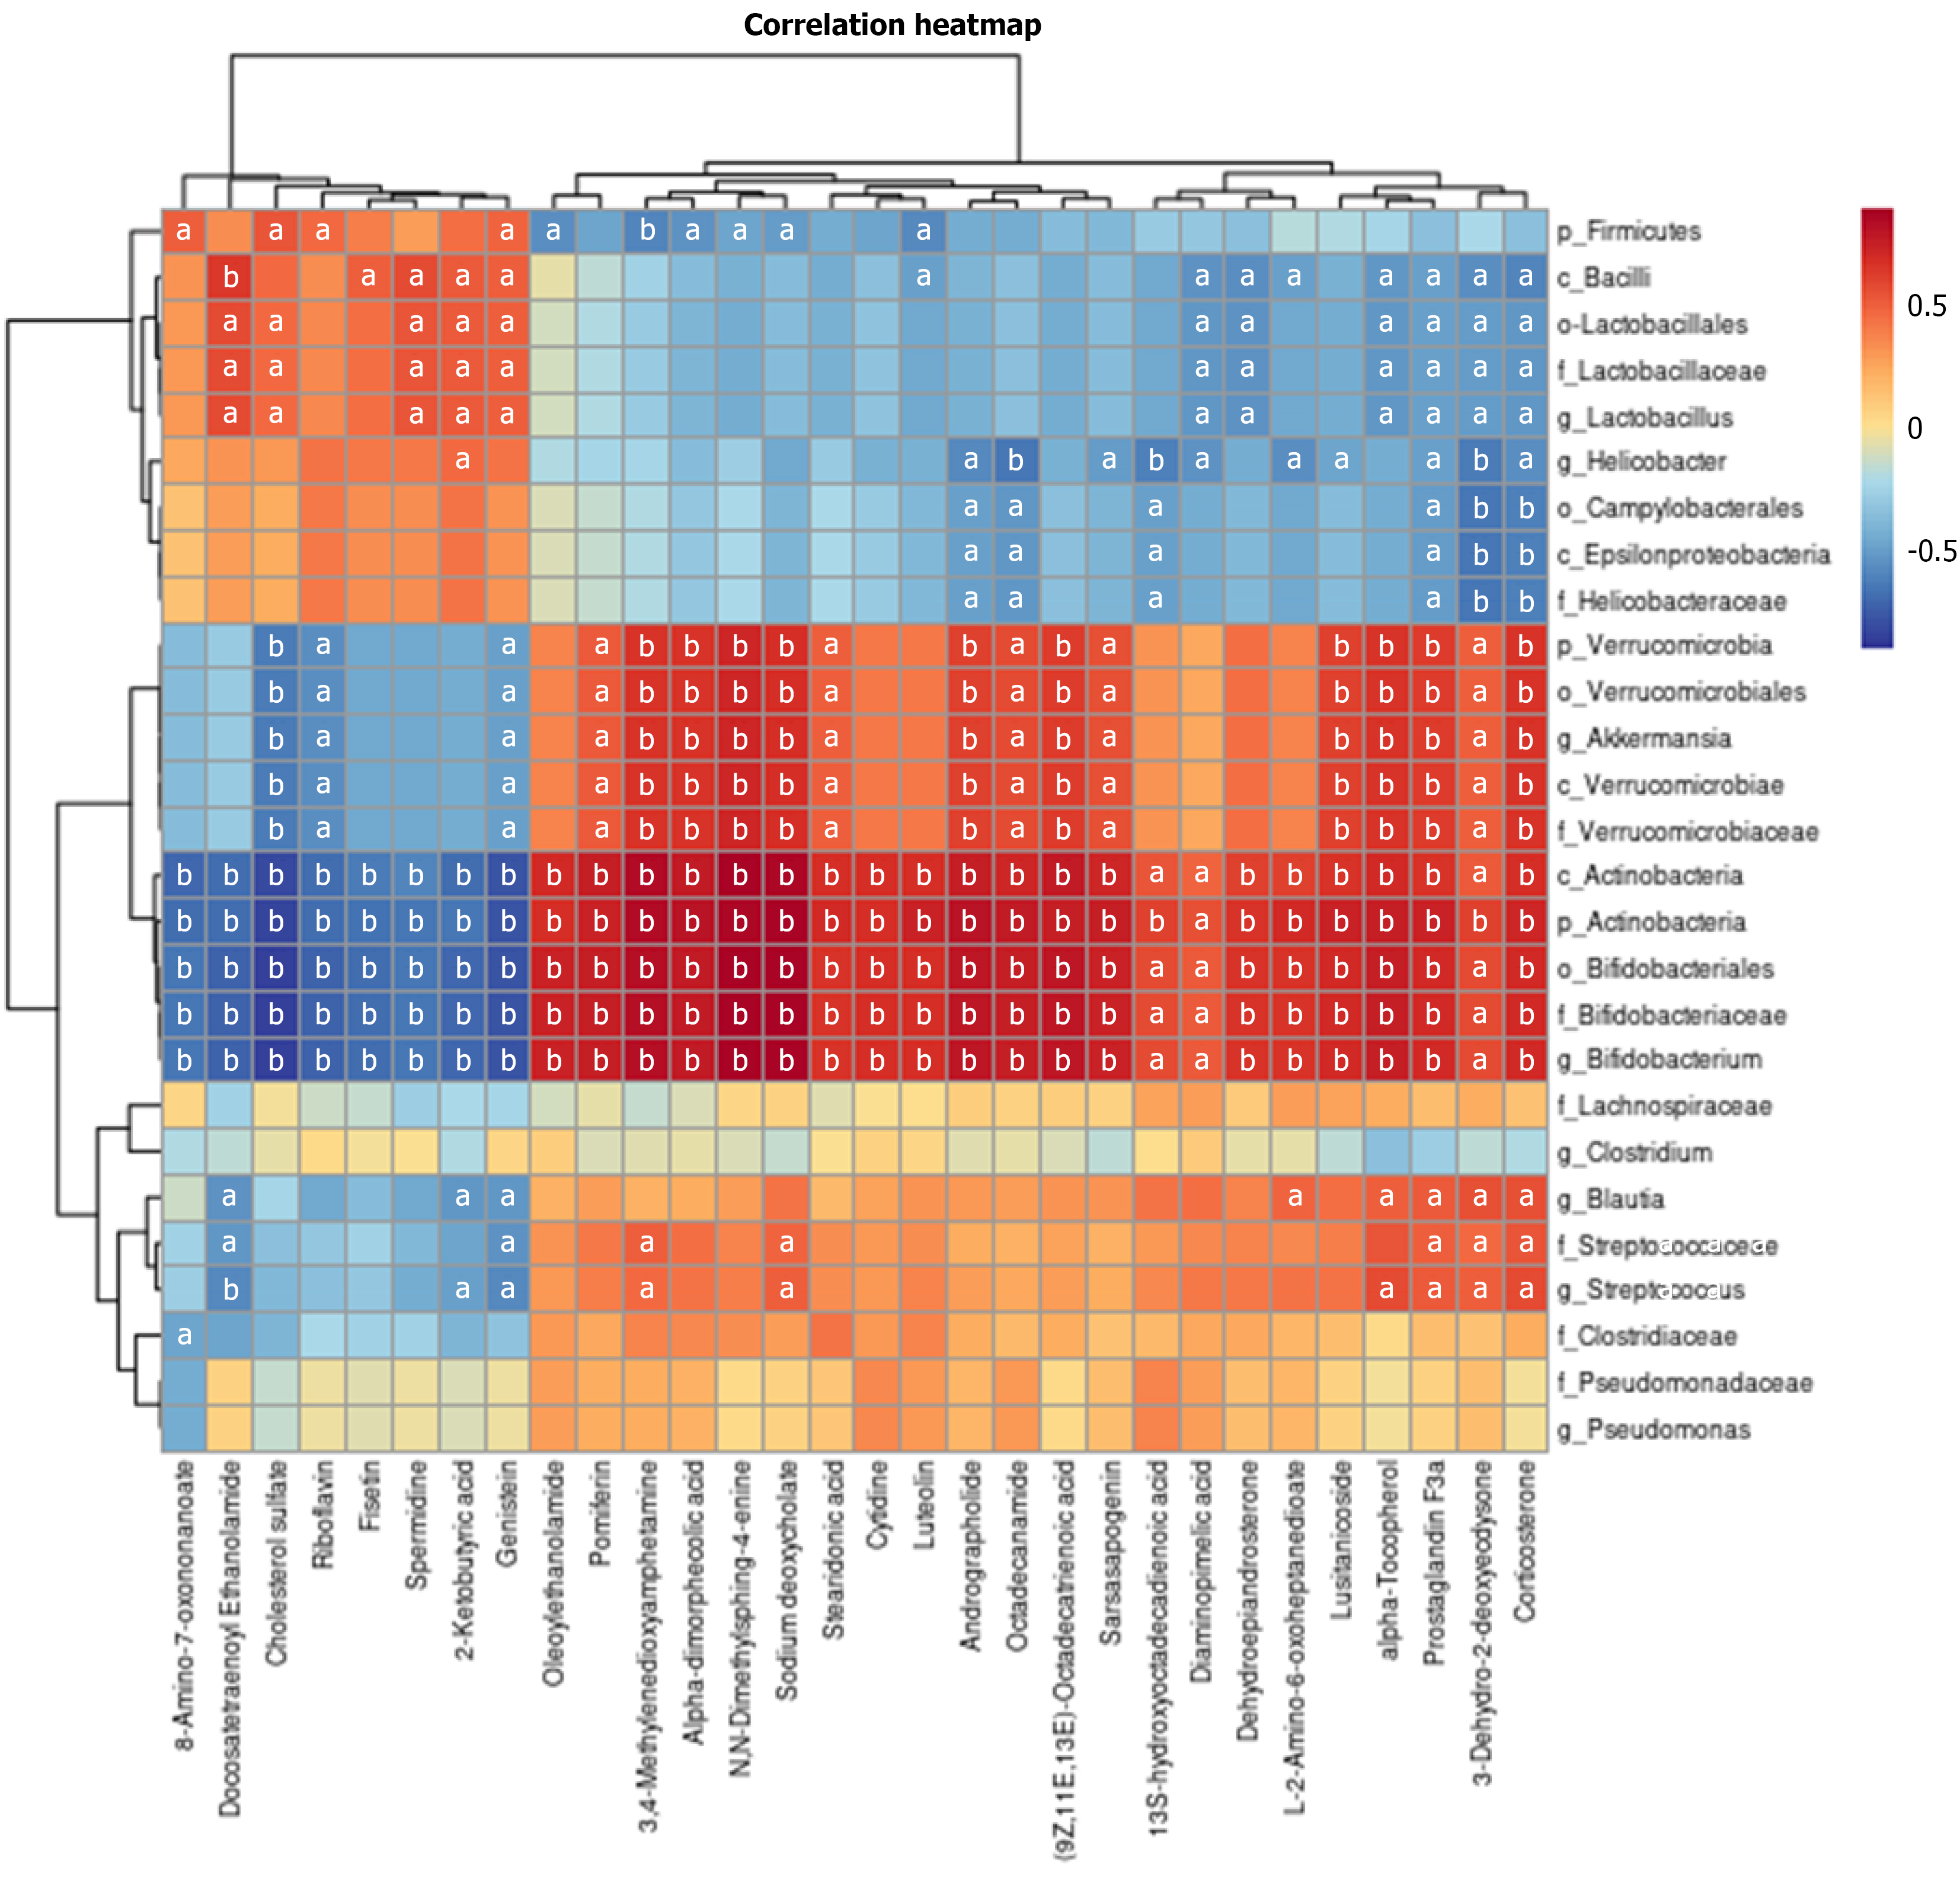
Figure 7 Association between different intestinal microbiota and different liver metabolites.
aP < 0.05, bP < 0.01 (color-coded: Red = positive, blue = negative). Data = mean ± SD. Groups were compared by one-way analysis of variance (Tukey’s test).
- Citation: Xiong JF, He Y, Jiang N, Liu YH, Chen GF, Zhao CQ, Zhang SY, Wu YJ, Xu H. Modulation of the gut-liver axis by oxymatrine alleviates metabolic dysfunction-associated steatotic liver disease. World J Gastroenterol 2026; 32(16): 116187
- URL: https://www.wjgnet.com/1007-9327/full/v32/i16/116187.htm
- DOI: https://dx.doi.org/10.3748/wjg.v32.i16.116187