
















Copyright: ©Author(s) 2026.
World J Gastroenterol. Apr 28, 2026; 32(16): 115969
Published online Apr 28, 2026. doi: 10.3748/wjg.v32.i16.115969
Published online Apr 28, 2026. doi: 10.3748/wjg.v32.i16.115969
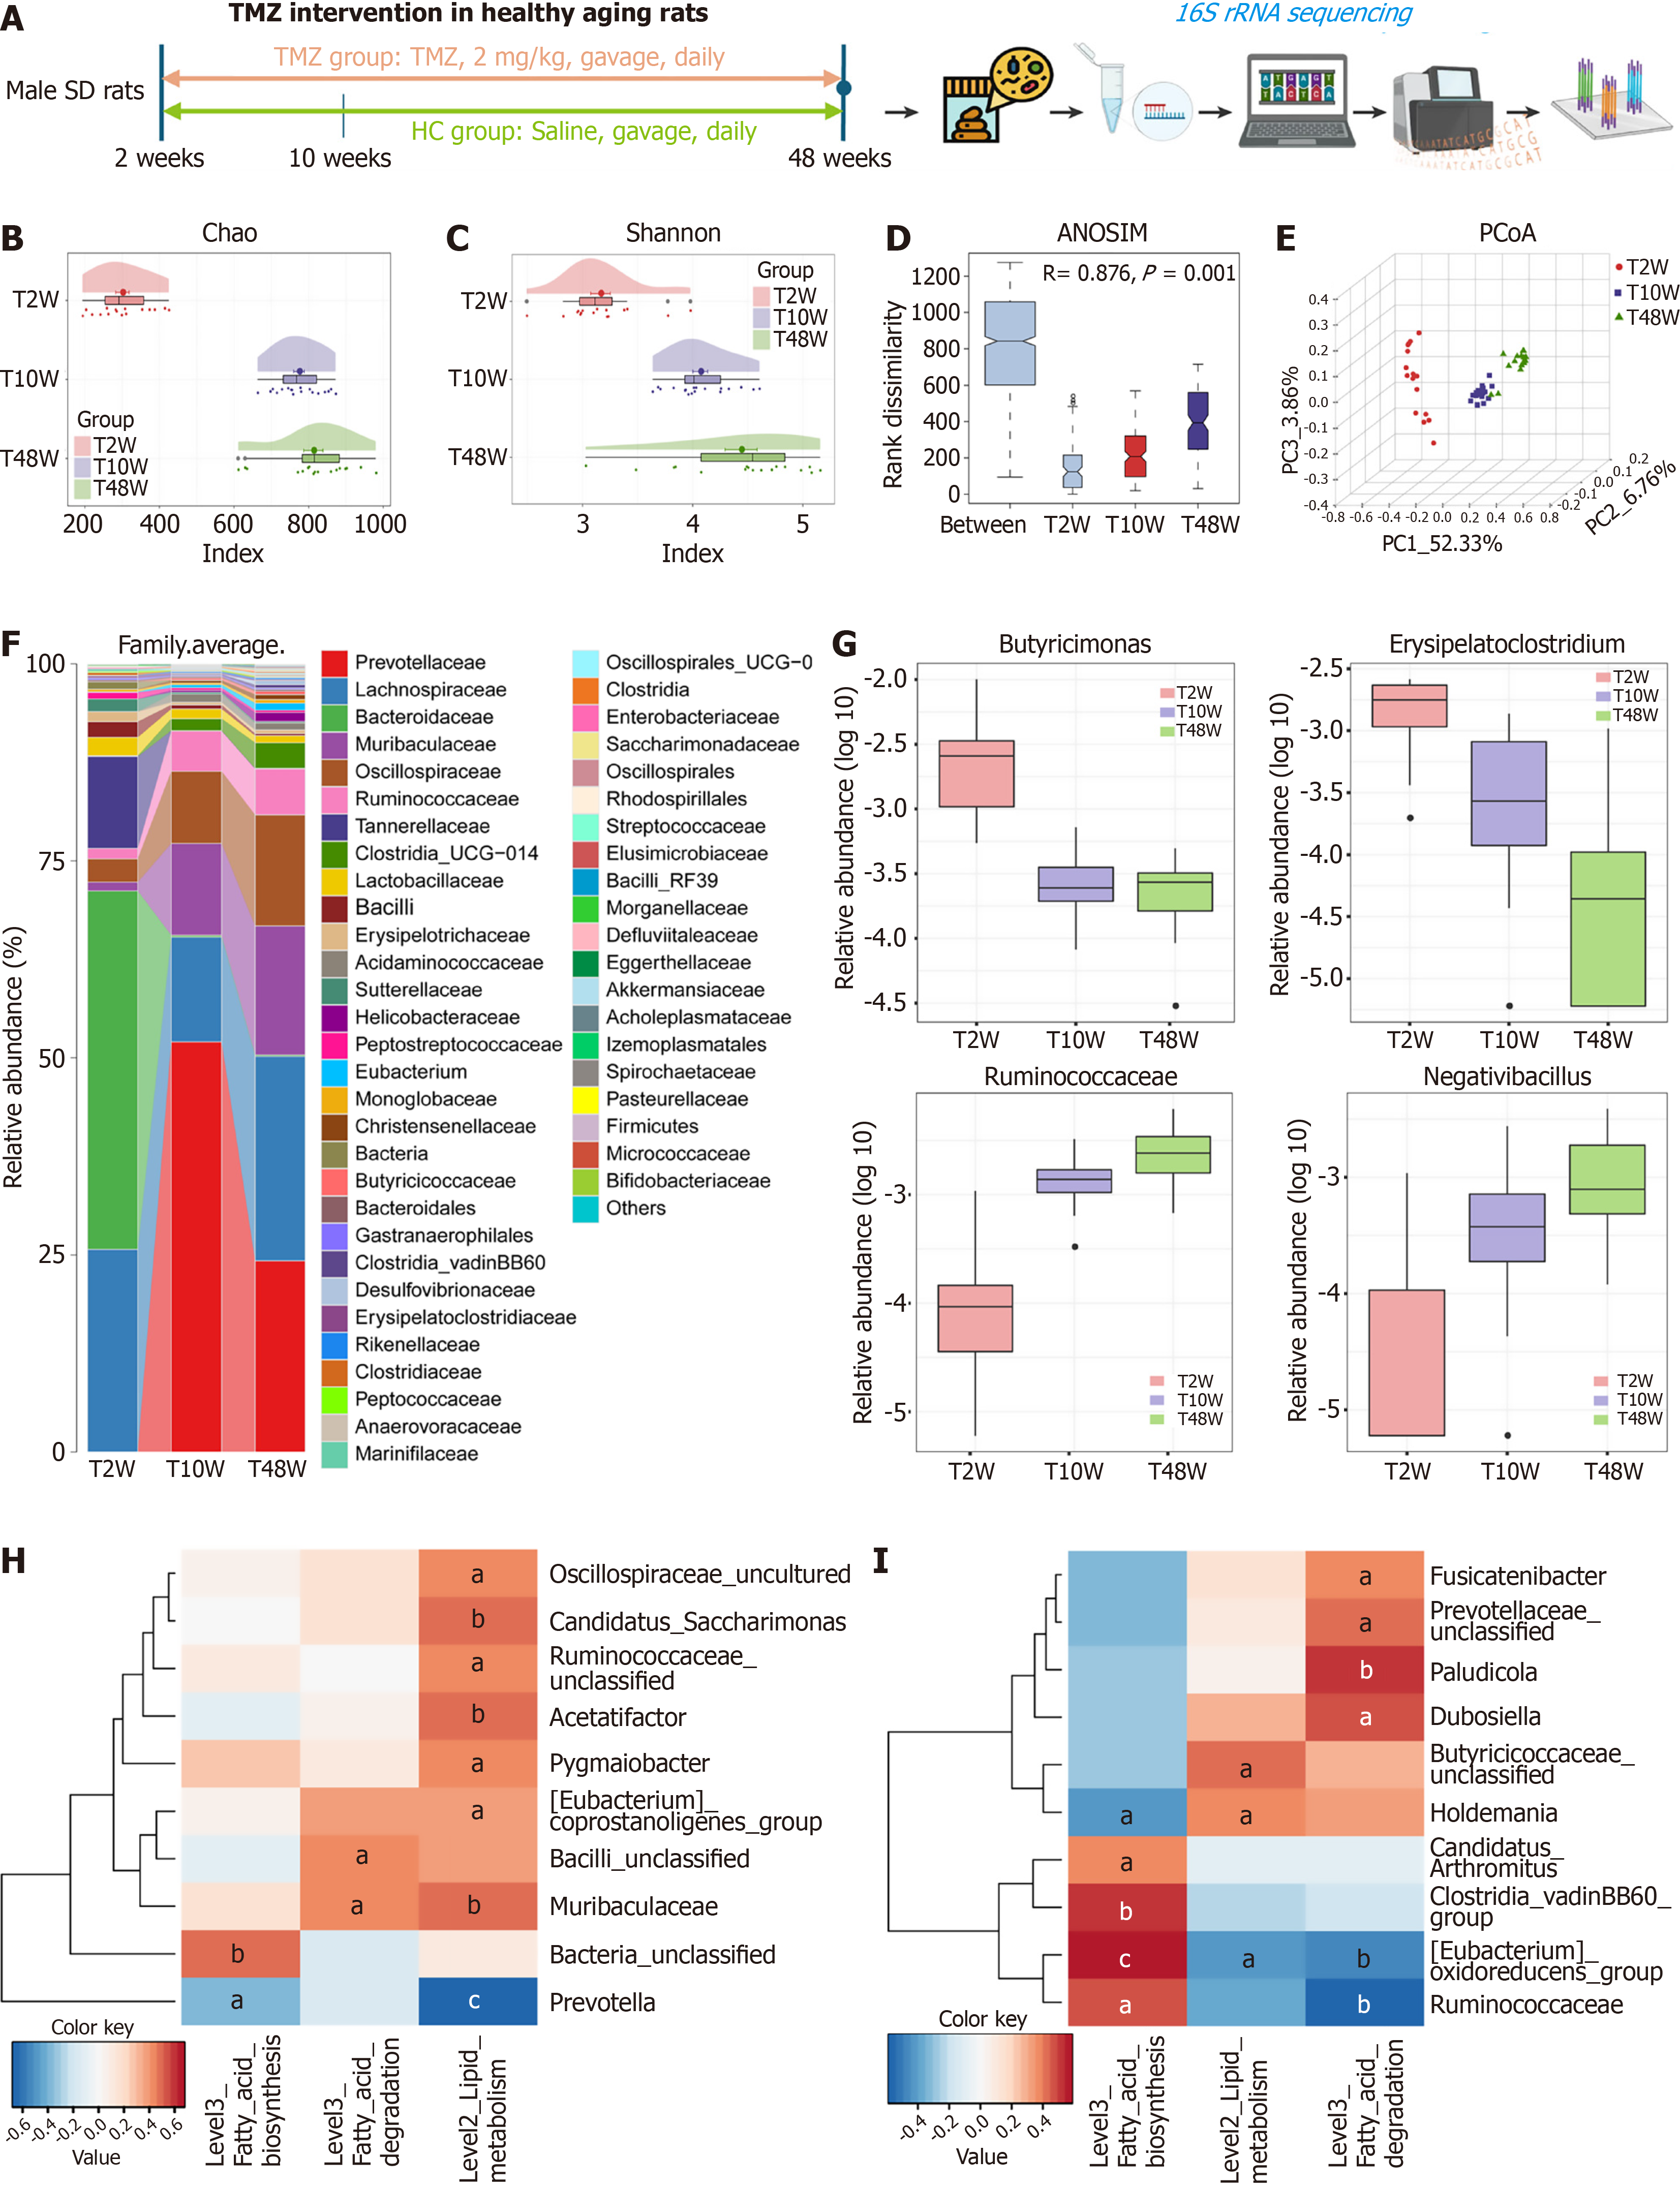
Figure 5 Trimetazidine intervention restored gut microbiota composition of healthy rats.
A: Schematic of the experimental intervention timeline for the animals; B and C: The Chao index (B) and Shannon index (C) indicated that the gut microbial community gradually increased from trimetazidine intervention group collected at 2, 10, and 48 weeks; D: Analysis of similarities; E: The principal coordinate analysis revealed the gut microbiome separated; F: Average compositions and relative abundance of the bacterial community among groups at the genus level; G: Relative abundances of Erysipelatoclostridium, Butyricimonas, Ruminococcaceae, and Negativibacillus; H and I: Correlation analysis between the gut microbiota and lipid metabolism-associated pathways at 10 weeks (H) and 48 weeks (I) of trimetazidine treatment (P < 0.05, false discovery rate corrected). aP < 0.05. bP < 0.01. cP < 0.001. TMZ: Trimetazidine; HC: Healthy control; T2W: Trimetazidine intervention group collected at 2 weeks; T10W: Trimetazidine intervention group collected at 10 weeks; T48W: Trimetazidine intervention group collected at 48 weeks; PCoA: Principal coordinate analysis; PC: Principal component; ANOSIM: Analysis of similarities.
- Citation: Wang XM, Rao BC, Su GY, Wang HY, Zhang GZ, Ge FL, Yu ZJ, Ren ZG, Liang HX. Age-related gut microbiome profile and reversal of microbial imbalance by trimetazidine intervention. World J Gastroenterol 2026; 32(16): 115969
- URL: https://www.wjgnet.com/1007-9327/full/v32/i16/115969.htm
- DOI: https://dx.doi.org/10.3748/wjg.v32.i16.115969