
















Copyright: ©Author(s) 2026.
World J Gastroenterol. Apr 28, 2026; 32(16): 115969
Published online Apr 28, 2026. doi: 10.3748/wjg.v32.i16.115969
Published online Apr 28, 2026. doi: 10.3748/wjg.v32.i16.115969
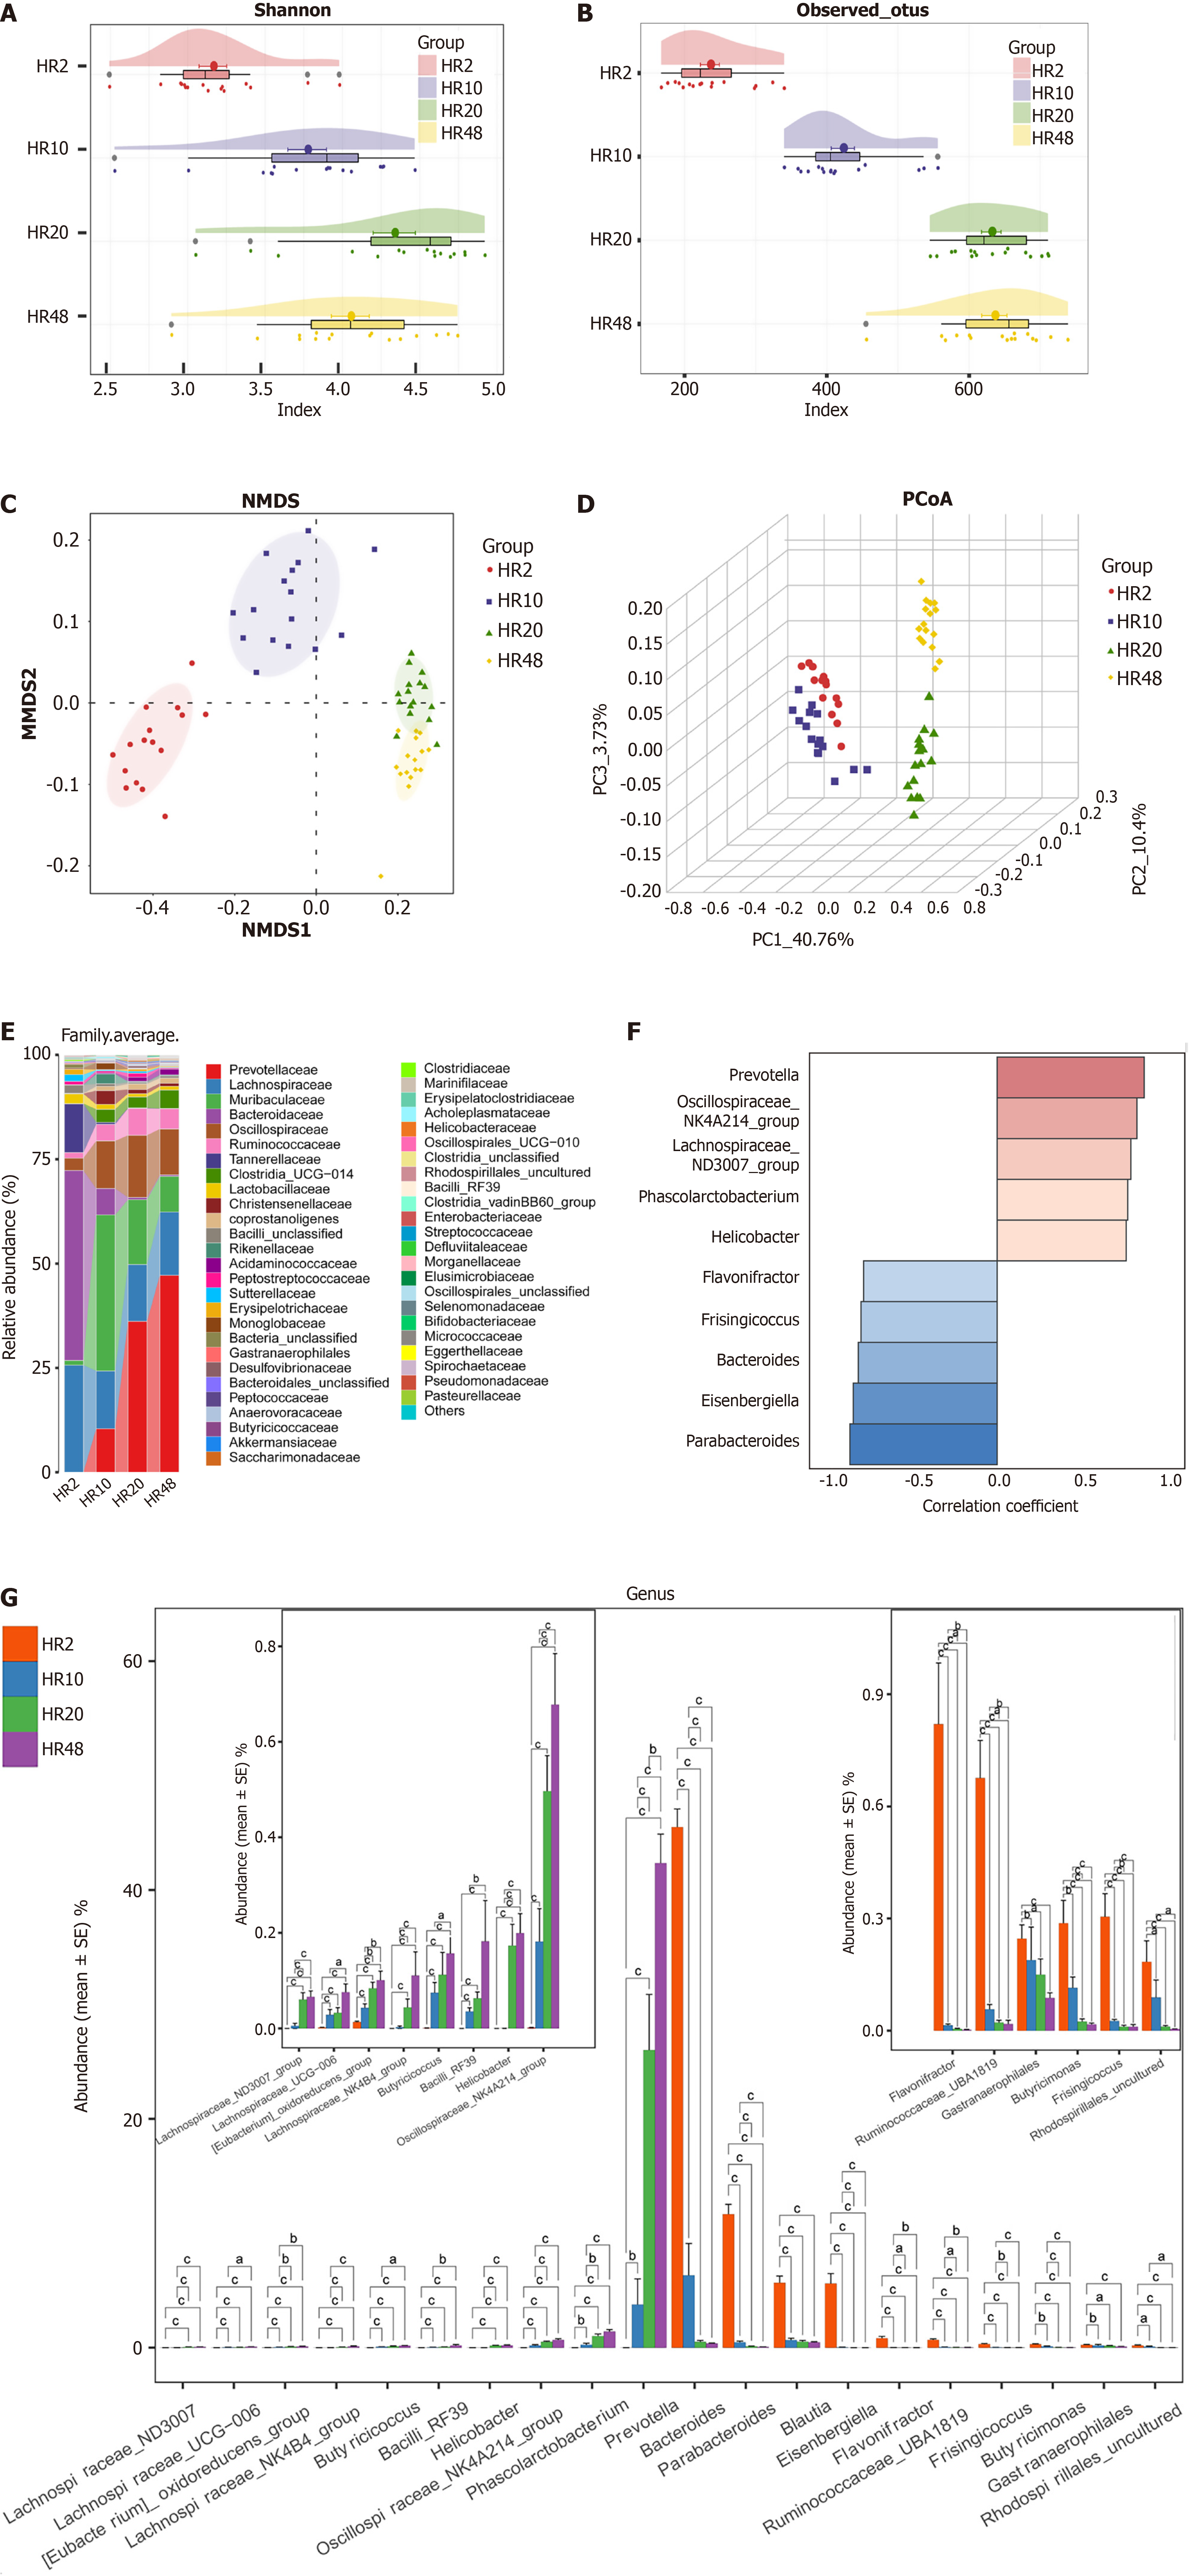
Figure 3 Gut microbiome profiles across different life stages in healthy rat cohort.
A and B: The Shannon index (A) and observed operational taxonomic units diversity indices (B) demonstrate the alpha diversity of the ten groups of the healthy rat cohort (HR) cohort; C and D: The nonmetric multidimensional scaling (C) and principal coordinate analysis (D) revealed differences in the gut microbiome among aged 2 weeks (n = 16), aged 10 weeks (n = 16), aged 20 weeks (n = 16) and aged 48 weeks (n = 16) groups; E: Average compositions and relative abundance of the bacterial community among groups at the genus level; F: Correlation analysis of the abundance of the major species with age. Heatmap showing the abundance-fold change in bacteria with age. In red: Bacteria that are more abundant; in blue: Bacteria that are less abundant. Scale: Log2 (fold change) = -1 (blue) < 0 (white) < 1 (red); G: Age-associated changes in differential gut microbial abundance in rats. aP < 0.05. bP < 0.01. cP < 0.001. HR: Healthy rat cohort; HR2: Aged 2 weeks; HR10: Aged 10 weeks; HR20: Aged 20 weeks; HR48: Aged 48 weeks; PCoA: Principal coordinate analysis; PC: Principal component; NMDS: Nonmetric multidimensional scaling.
- Citation: Wang XM, Rao BC, Su GY, Wang HY, Zhang GZ, Ge FL, Yu ZJ, Ren ZG, Liang HX. Age-related gut microbiome profile and reversal of microbial imbalance by trimetazidine intervention. World J Gastroenterol 2026; 32(16): 115969
- URL: https://www.wjgnet.com/1007-9327/full/v32/i16/115969.htm
- DOI: https://dx.doi.org/10.3748/wjg.v32.i16.115969