
















Copyright: ©Author(s) 2026.
World J Gastroenterol. Apr 21, 2026; 32(15): 116679
Published online Apr 21, 2026. doi: 10.3748/wjg.v32.i15.116679
Published online Apr 21, 2026. doi: 10.3748/wjg.v32.i15.116679
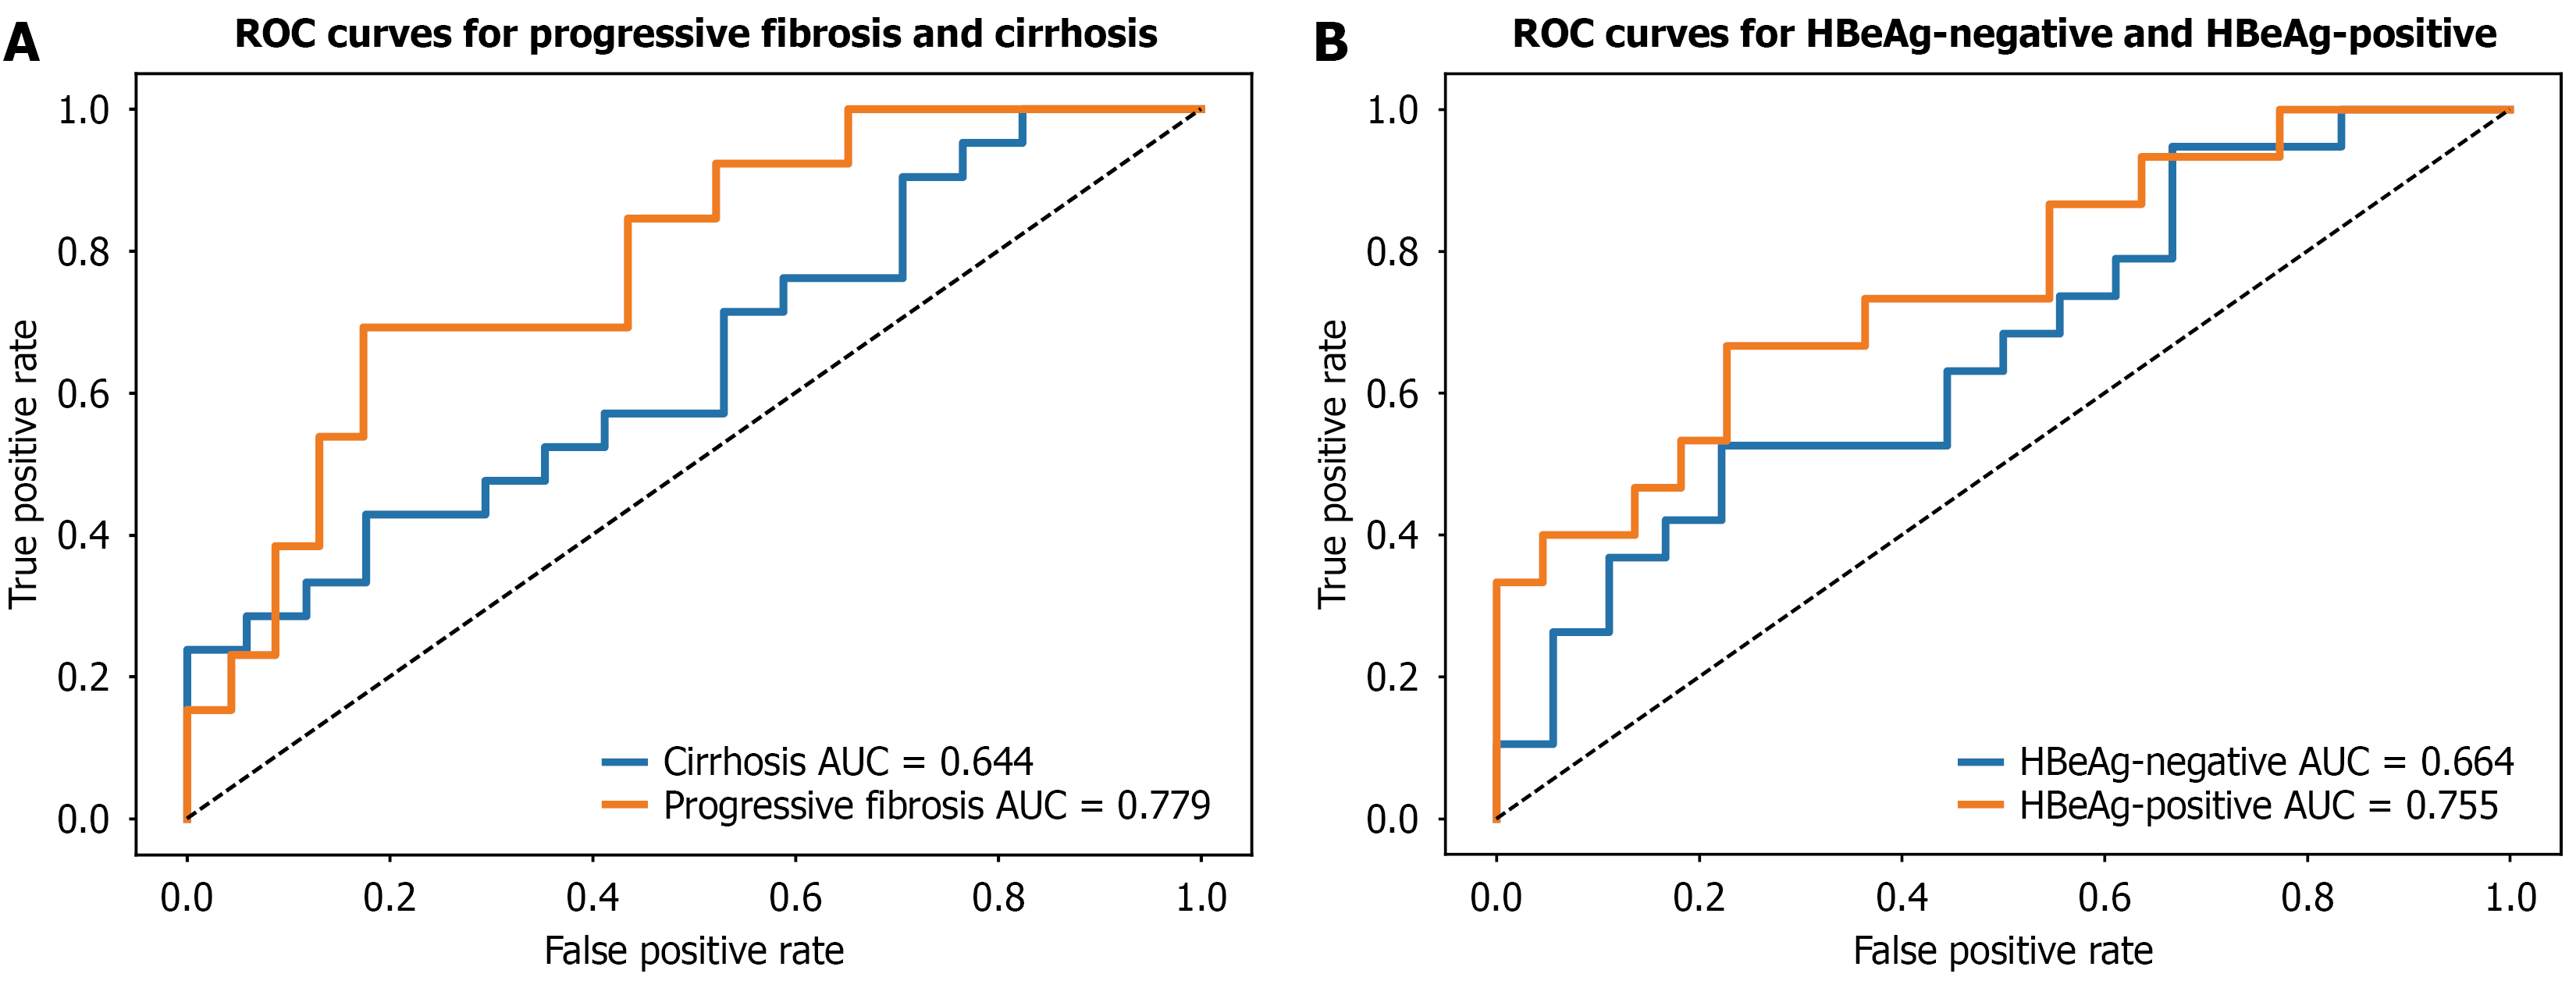
Figure 4 Subgroup analysis.
A: Multimodal model performance in the progressive fibrosis (orange) and cirrhosis (blue) subgroup; B: Multimodal model performance in the hepatitis B e antigen-positive (orange) and hepatitis B e antigen-negative subgroup (blue). HBeAg: Hepatitis B e antigen; ROC: Receiver operating characteristic; AUC: Area under the receiver operating characteristic curve.
- Citation: Han W, Cheng DY, He QW, Wang SH, Gong SJ, Chen Y, Yang YP. Deep learning-based multimodal model for predicting on-treatment histological outcomes in chronic hepatitis B-associated advanced liver fibrosis. World J Gastroenterol 2026; 32(15): 116679
- URL: https://www.wjgnet.com/1007-9327/full/v32/i15/116679.htm
- DOI: https://dx.doi.org/10.3748/wjg.v32.i15.116679