
















Copyright: ©Author(s) 2026.
World J Gastroenterol. Apr 14, 2026; 32(14): 116415
Published online Apr 14, 2026. doi: 10.3748/wjg.v32.i14.116415
Published online Apr 14, 2026. doi: 10.3748/wjg.v32.i14.116415
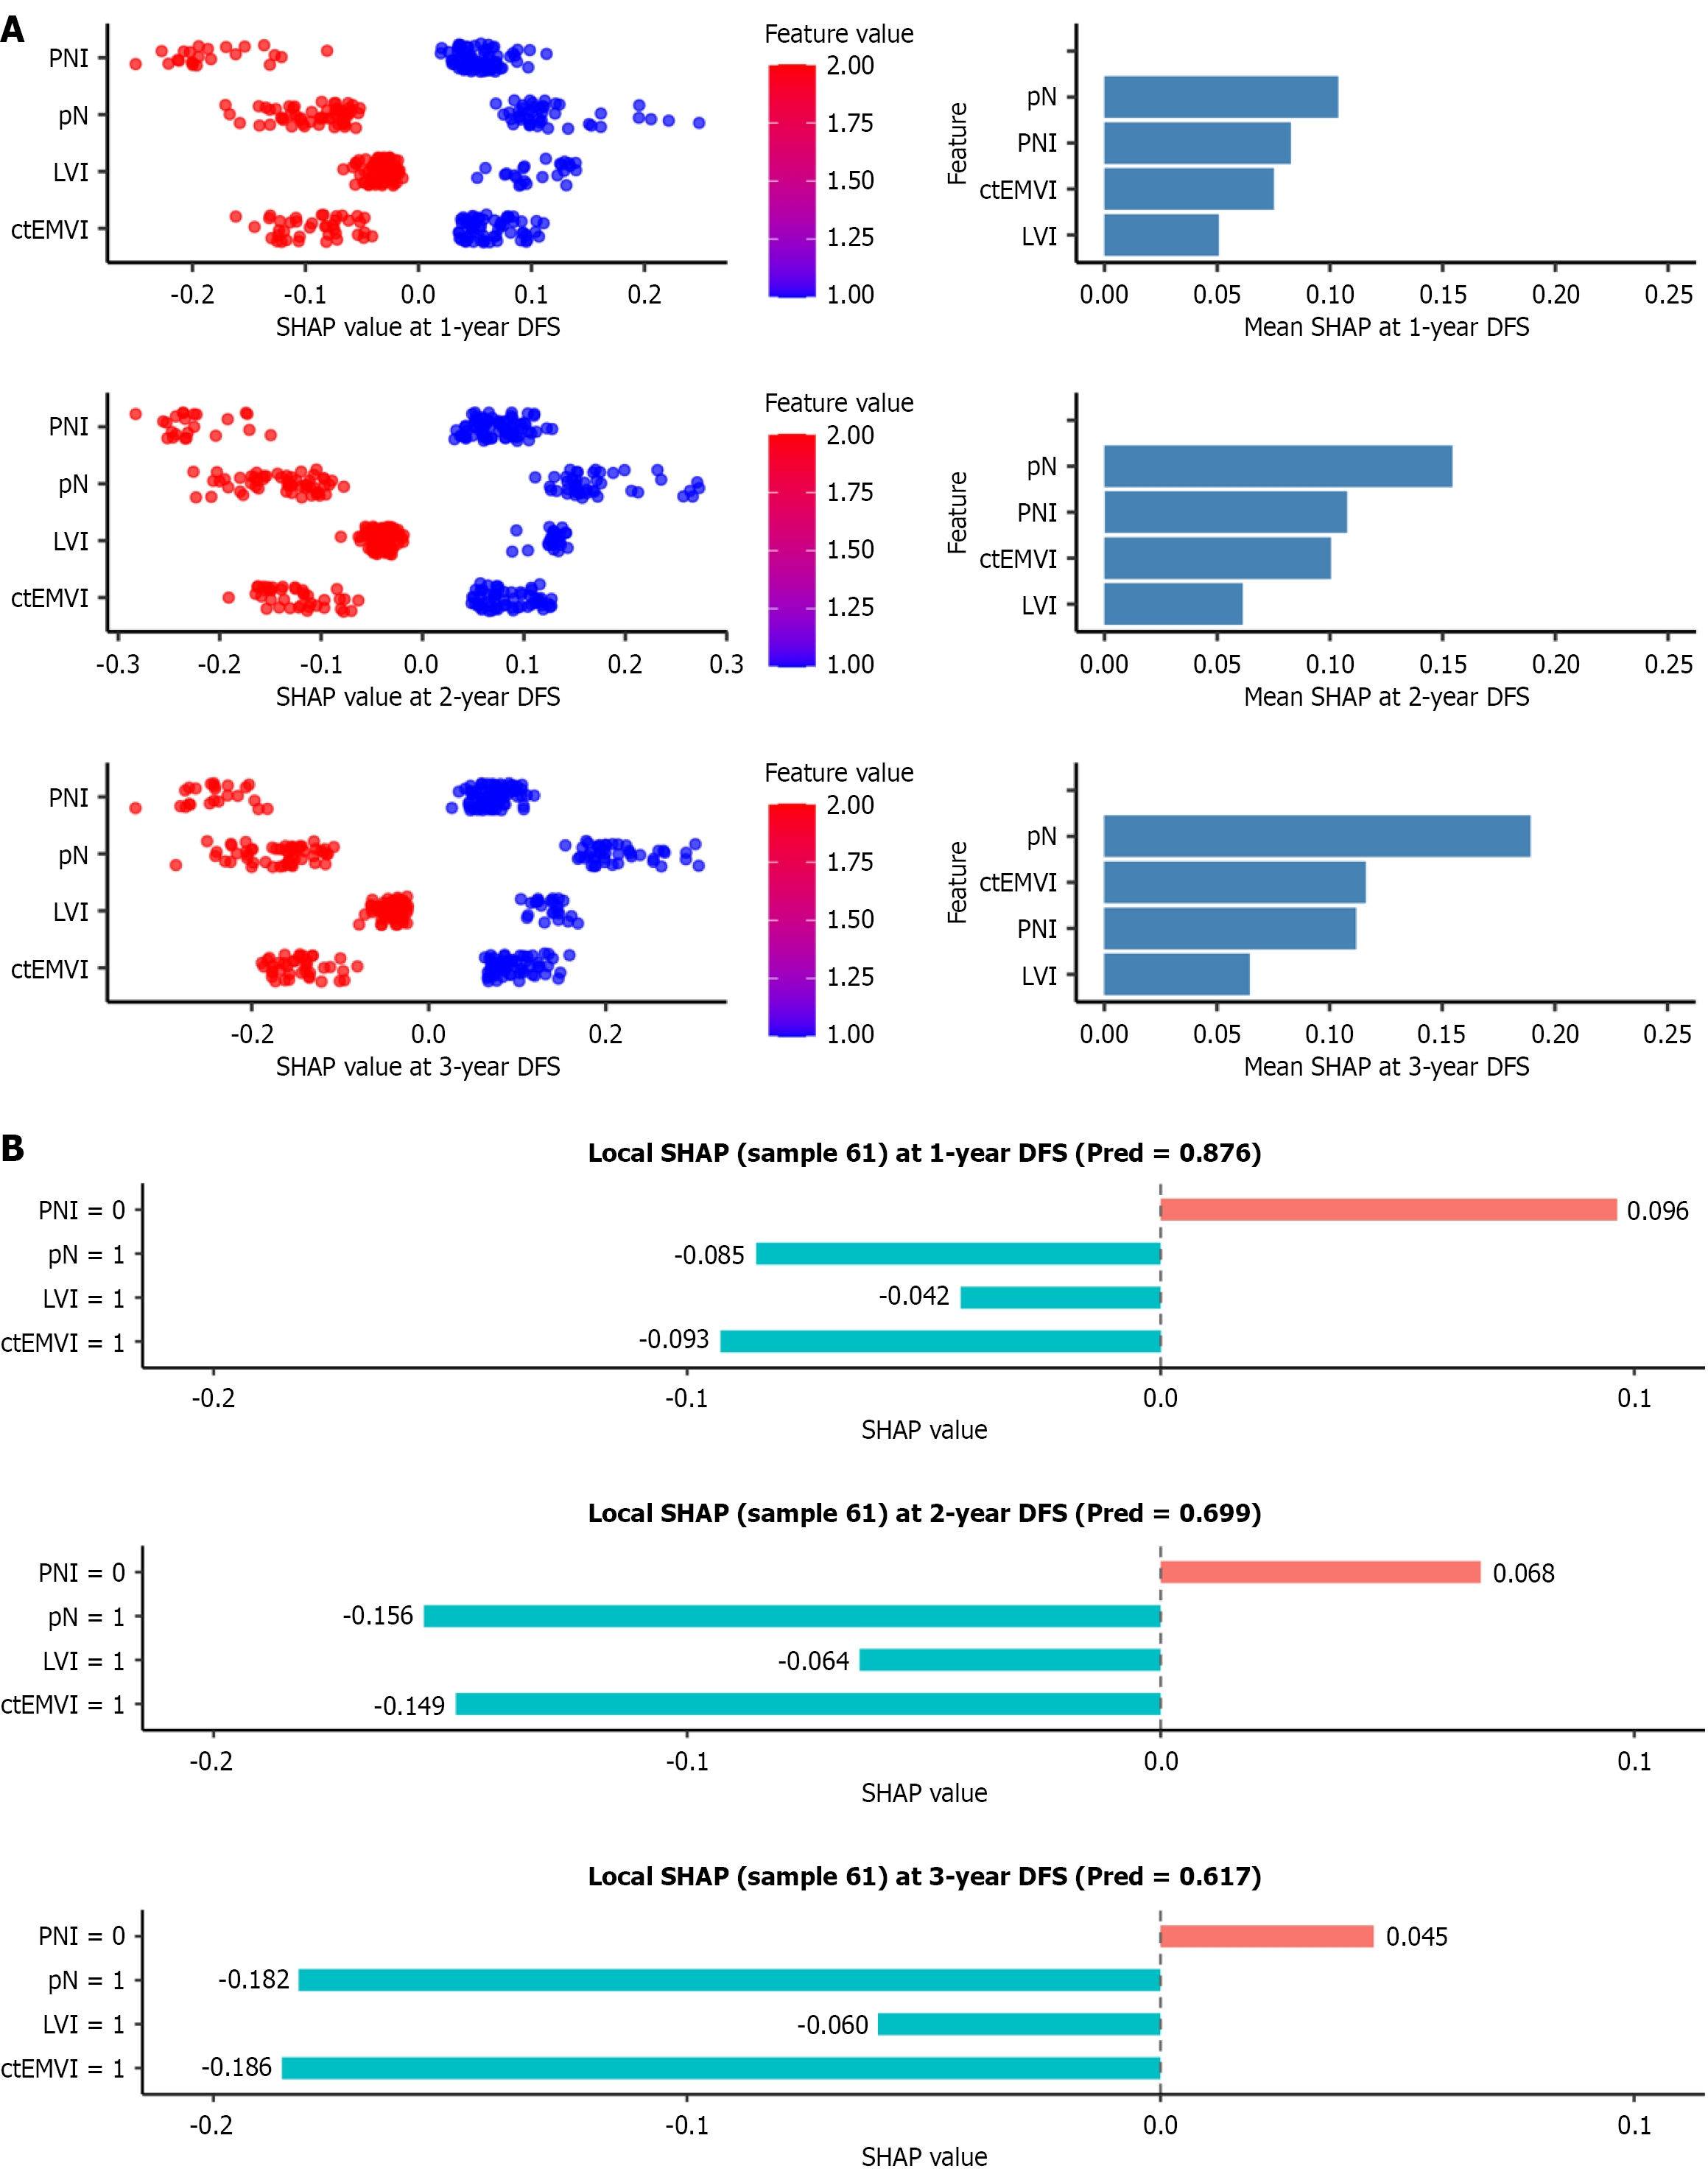
Figure 7 SHapley Additive exPlanations interprets the model.
A: Attributes of characteristics in SHapley Additive exPlanations. The scatter plot on the left shows the distribution of SHapley Additive exPlanations values for each case with respect to the given feature. The bar chart on the right displays the overall importance ranking of the features in disease-free survival (DFS) prediction; B: Individual efforts by patients with DFS after surgery. The predicted probabilities of DFS at 1-year, 2-year, and 3-year are 0.876, 0.699, and 0.617, respectively. In the figure, red features indicate an increase in the predicted probability, while blue features indicate a decrease in the predicted probability. ctEMVI: Computed tomography-detected extramural vascular invasion; DFS: Disease-free survival; LVI: Lymphovascular invasion; pN: Pathological nodal status; PNI: Perineural invasion; SHAP: SHapley Additive exPlanations.
- Citation: Wang MR, Zheng LF, Yang F, Gu XY, Yang JS, Chen FX, Liu JM, He BS. Development and validation of prognostic models for colon cancer incorporating extramural vascular invasion assessed by contrast-enhanced computed tomography. World J Gastroenterol 2026; 32(14): 116415
- URL: https://www.wjgnet.com/1007-9327/full/v32/i14/116415.htm
- DOI: https://dx.doi.org/10.3748/wjg.v32.i14.116415