
















Copyright: ©Author(s) 2026.
World J Gastroenterol. Apr 14, 2026; 32(14): 115162
Published online Apr 14, 2026. doi: 10.3748/wjg.v32.i14.115162
Published online Apr 14, 2026. doi: 10.3748/wjg.v32.i14.115162
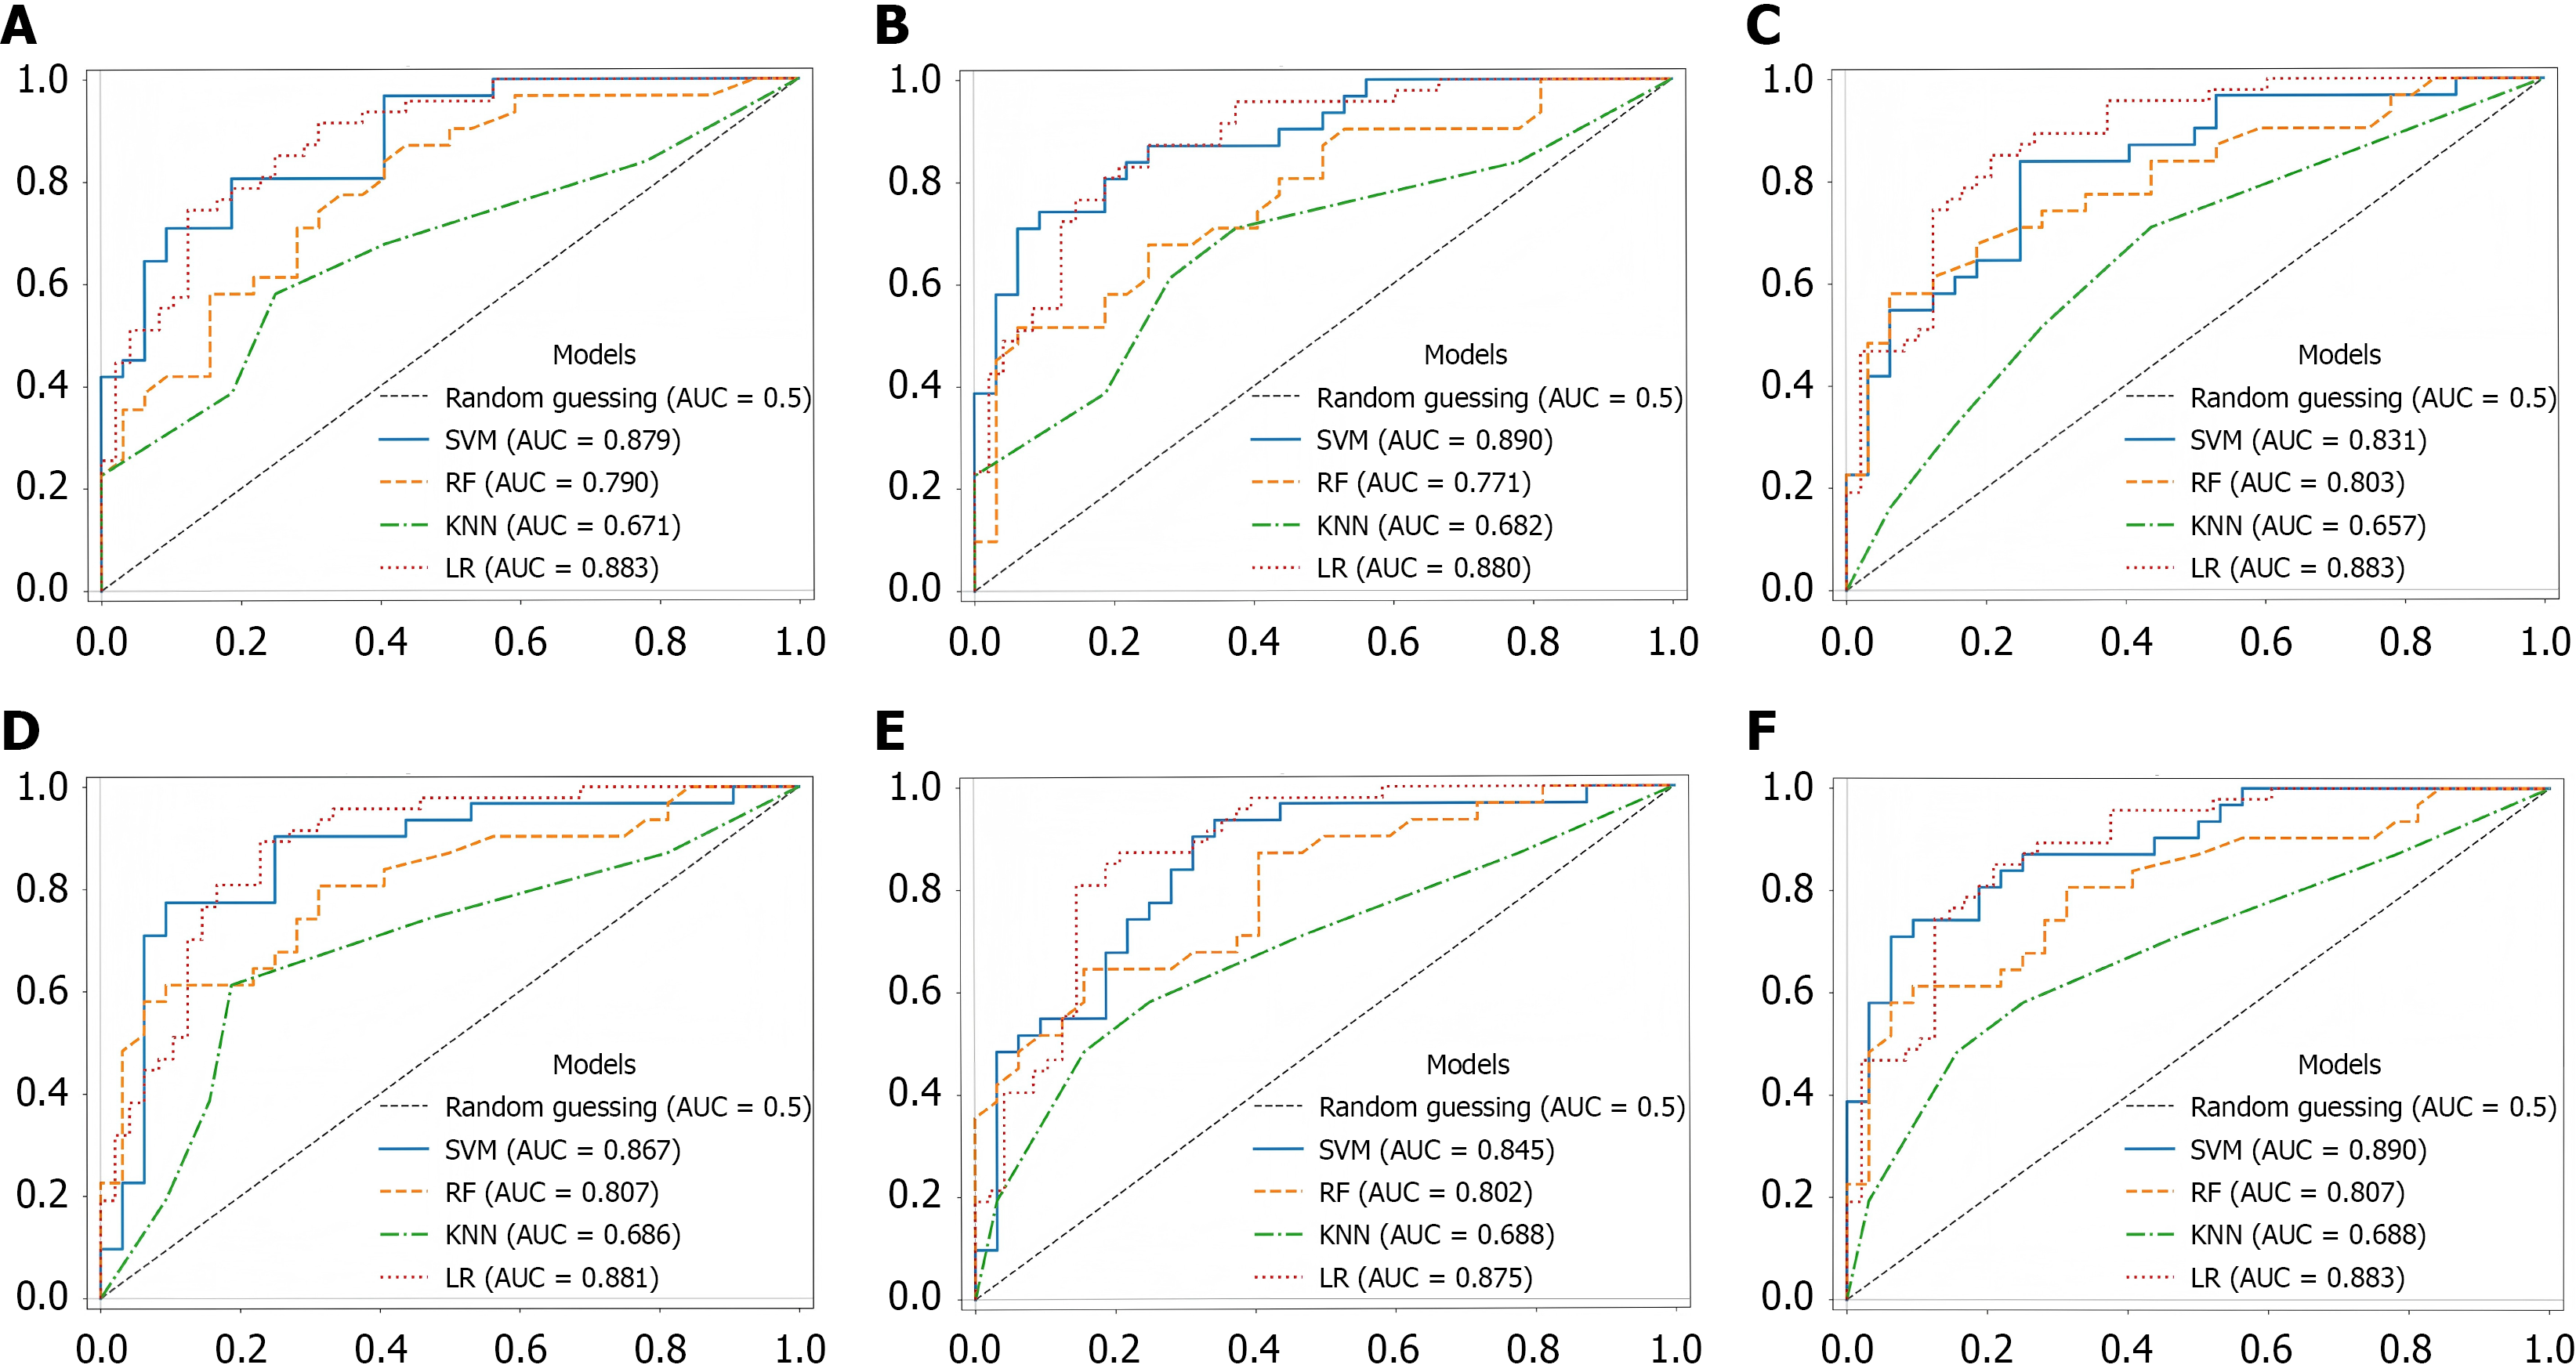
Figure 7 Receiver operating characteristic curves and area under the curve values of each model.
A-E: Show the top 20, 25, 30, 35, and 40 feature subsets; F: Presents the area under the curve for each model under its respective optimal feature subset size. AUC: Area under the curve; SVM: Support vector machine; RF: Random forest; KNN: K-nearest neighbors; LR: Logistic regression.
- Citation: Zhang L, Wang MY, Wei SY, Su C, Hu SY, Ren XY, Liu YP, Liu C, Wan Y. Predicting gastrointestinal bleeding and audio biomarkers based on machine learning analysis of bowel sounds. World J Gastroenterol 2026; 32(14): 115162
- URL: https://www.wjgnet.com/1007-9327/full/v32/i14/115162.htm
- DOI: https://dx.doi.org/10.3748/wjg.v32.i14.115162