
















Copyright: ©Author(s) 2026.
World J Gastroenterol. Apr 14, 2026; 32(14): 111455
Published online Apr 14, 2026. doi: 10.3748/wjg.v32.i14.111455
Published online Apr 14, 2026. doi: 10.3748/wjg.v32.i14.111455
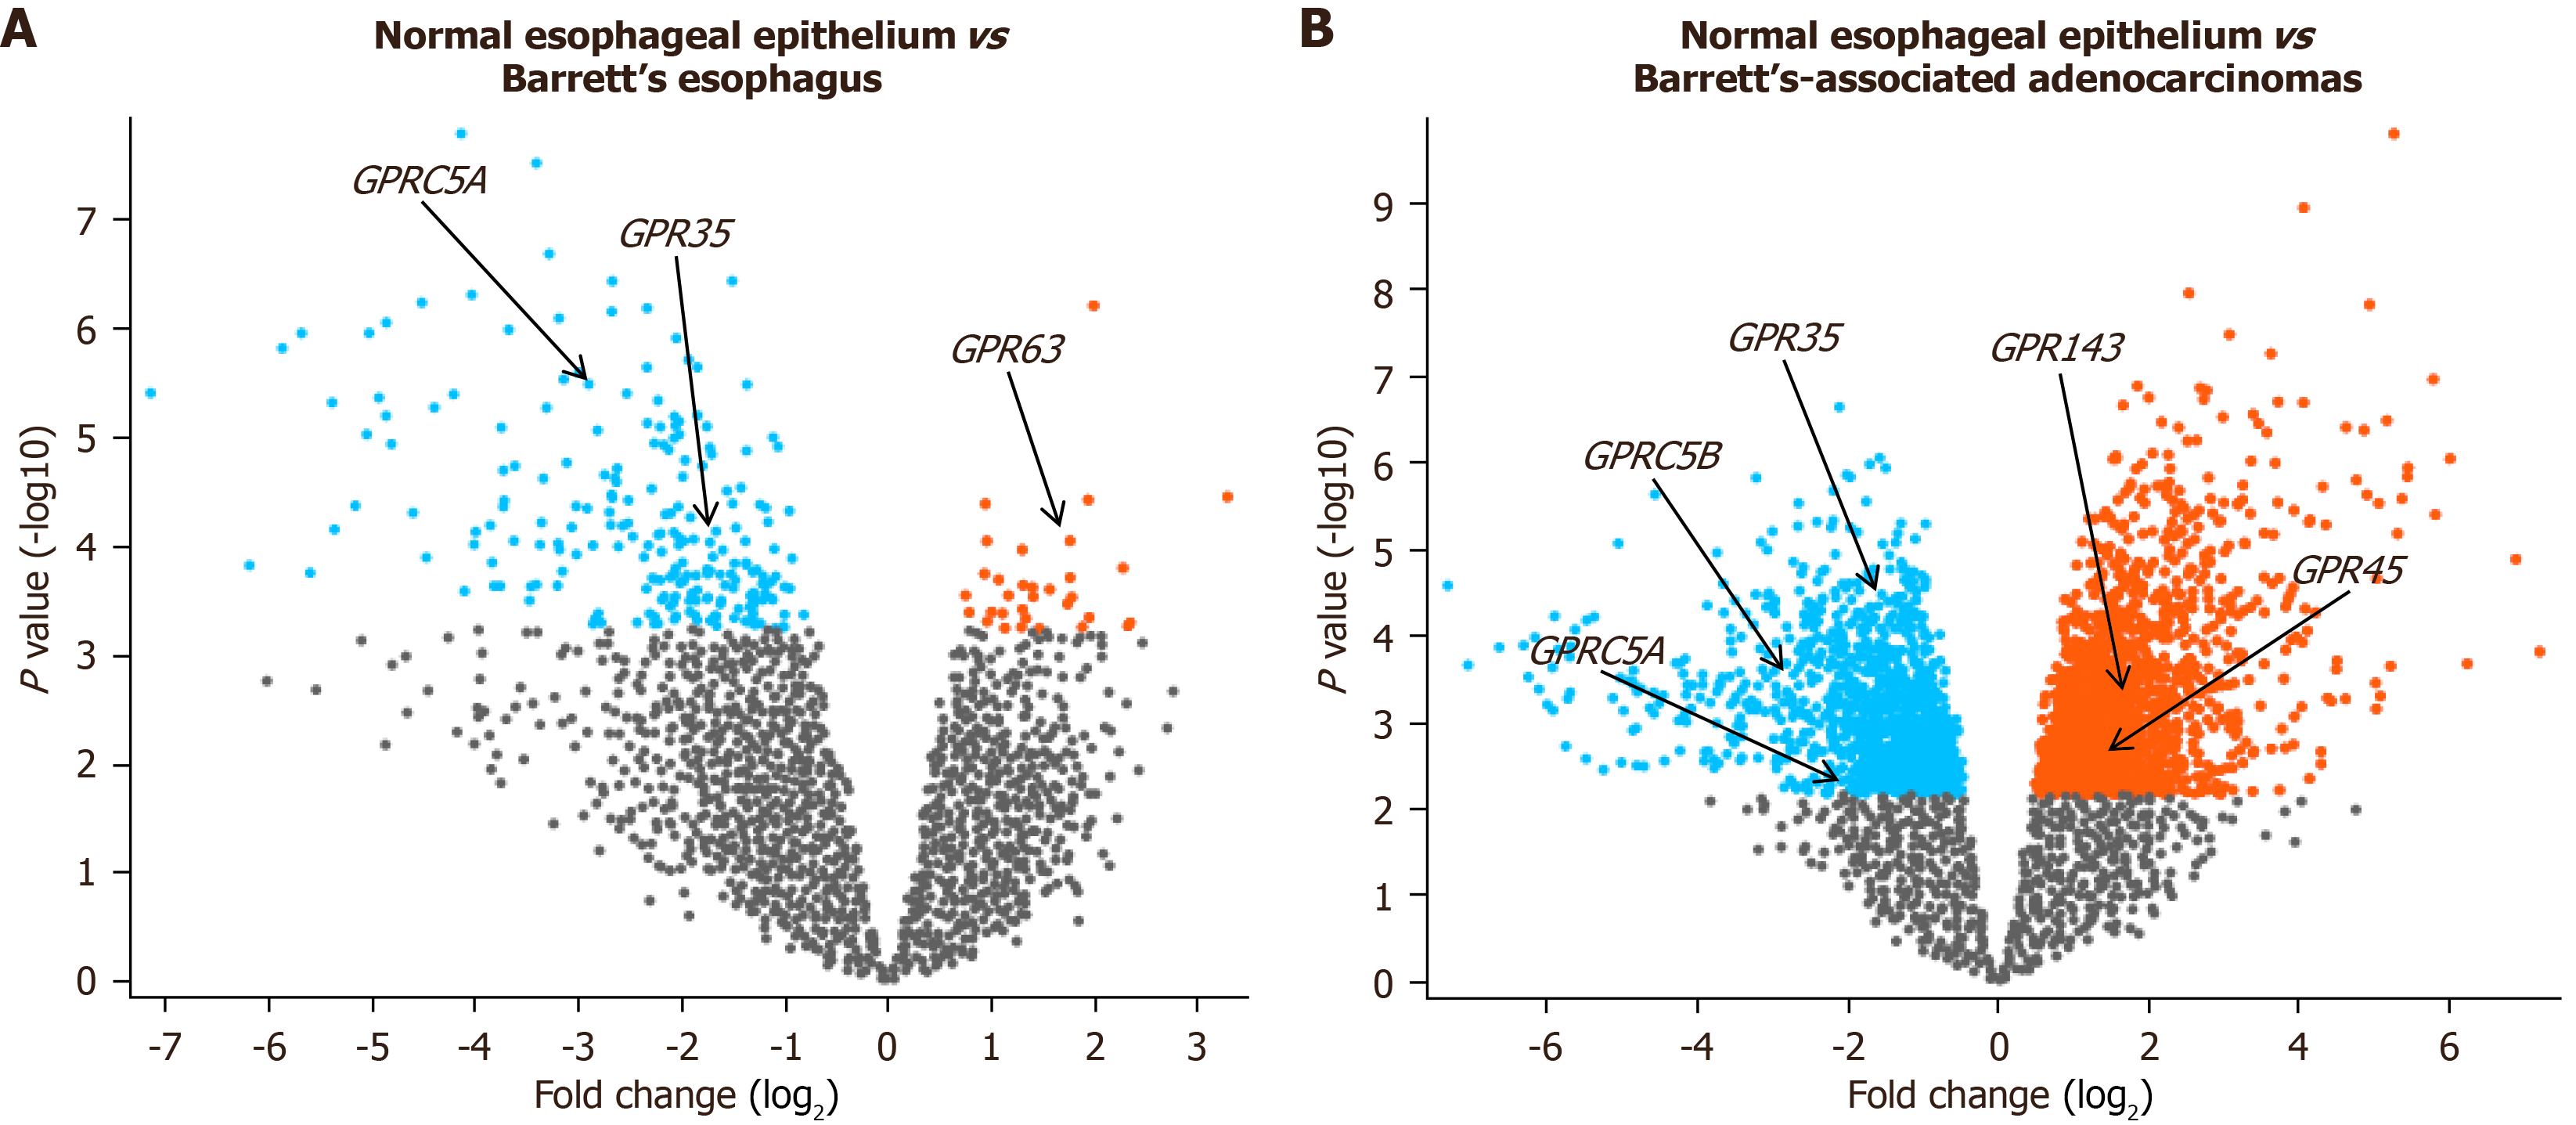
Figure 6 Dysregulation of G-protein coupled receptor gene expression in clinical Barrett’s esophagus and Barrett’s esophagus-associated esophageal adenocarcinoma.
A: The volcano represents differentially expressed genes in clinical Barrett’s esophagus (BE) (n = 8) compared to the normal esophageal epithelium (n = 8). The data were obtained from the GSE database (GSE1420). BE upregulated (blue) and downregulated (red) genes were identified using the GEO2R tool, based on log2 fold change > 0.9 and adjusted P values of < 0.05; B: The volcano represents differentially expressed genes in clinical BE-associated esophageal adenocarcinoma (EAC) (n = 8) compared to the normal esophageal epithelium (n = 8). The data were obtained from the GSE database (GSE1420). EAC upregulated (blue) and downregulated (red) genes were identified using the GEO2R tool, based on log2 fold change > 0.9 and adjusted P values of < 0.05.
- Citation: Goldman A, Gonzalez G, Karpova SA, Buon L, Shammas MA, Mashimo H, Frank MH, Frank NY. Optimal cannabinoid-terpene combination ratios suppress mutagenicity of gastric reflux in normal and metaplastic esophageal cells. World J Gastroenterol 2026; 32(14): 111455
- URL: https://www.wjgnet.com/1007-9327/full/v32/i14/111455.htm
- DOI: https://dx.doi.org/10.3748/wjg.v32.i14.111455