











Copyright: ©Author(s) 2026.
World J Gastroenterol. Apr 7, 2026; 32(13): 115710
Published online Apr 7, 2026. doi: 10.3748/wjg.v32.i13.115710
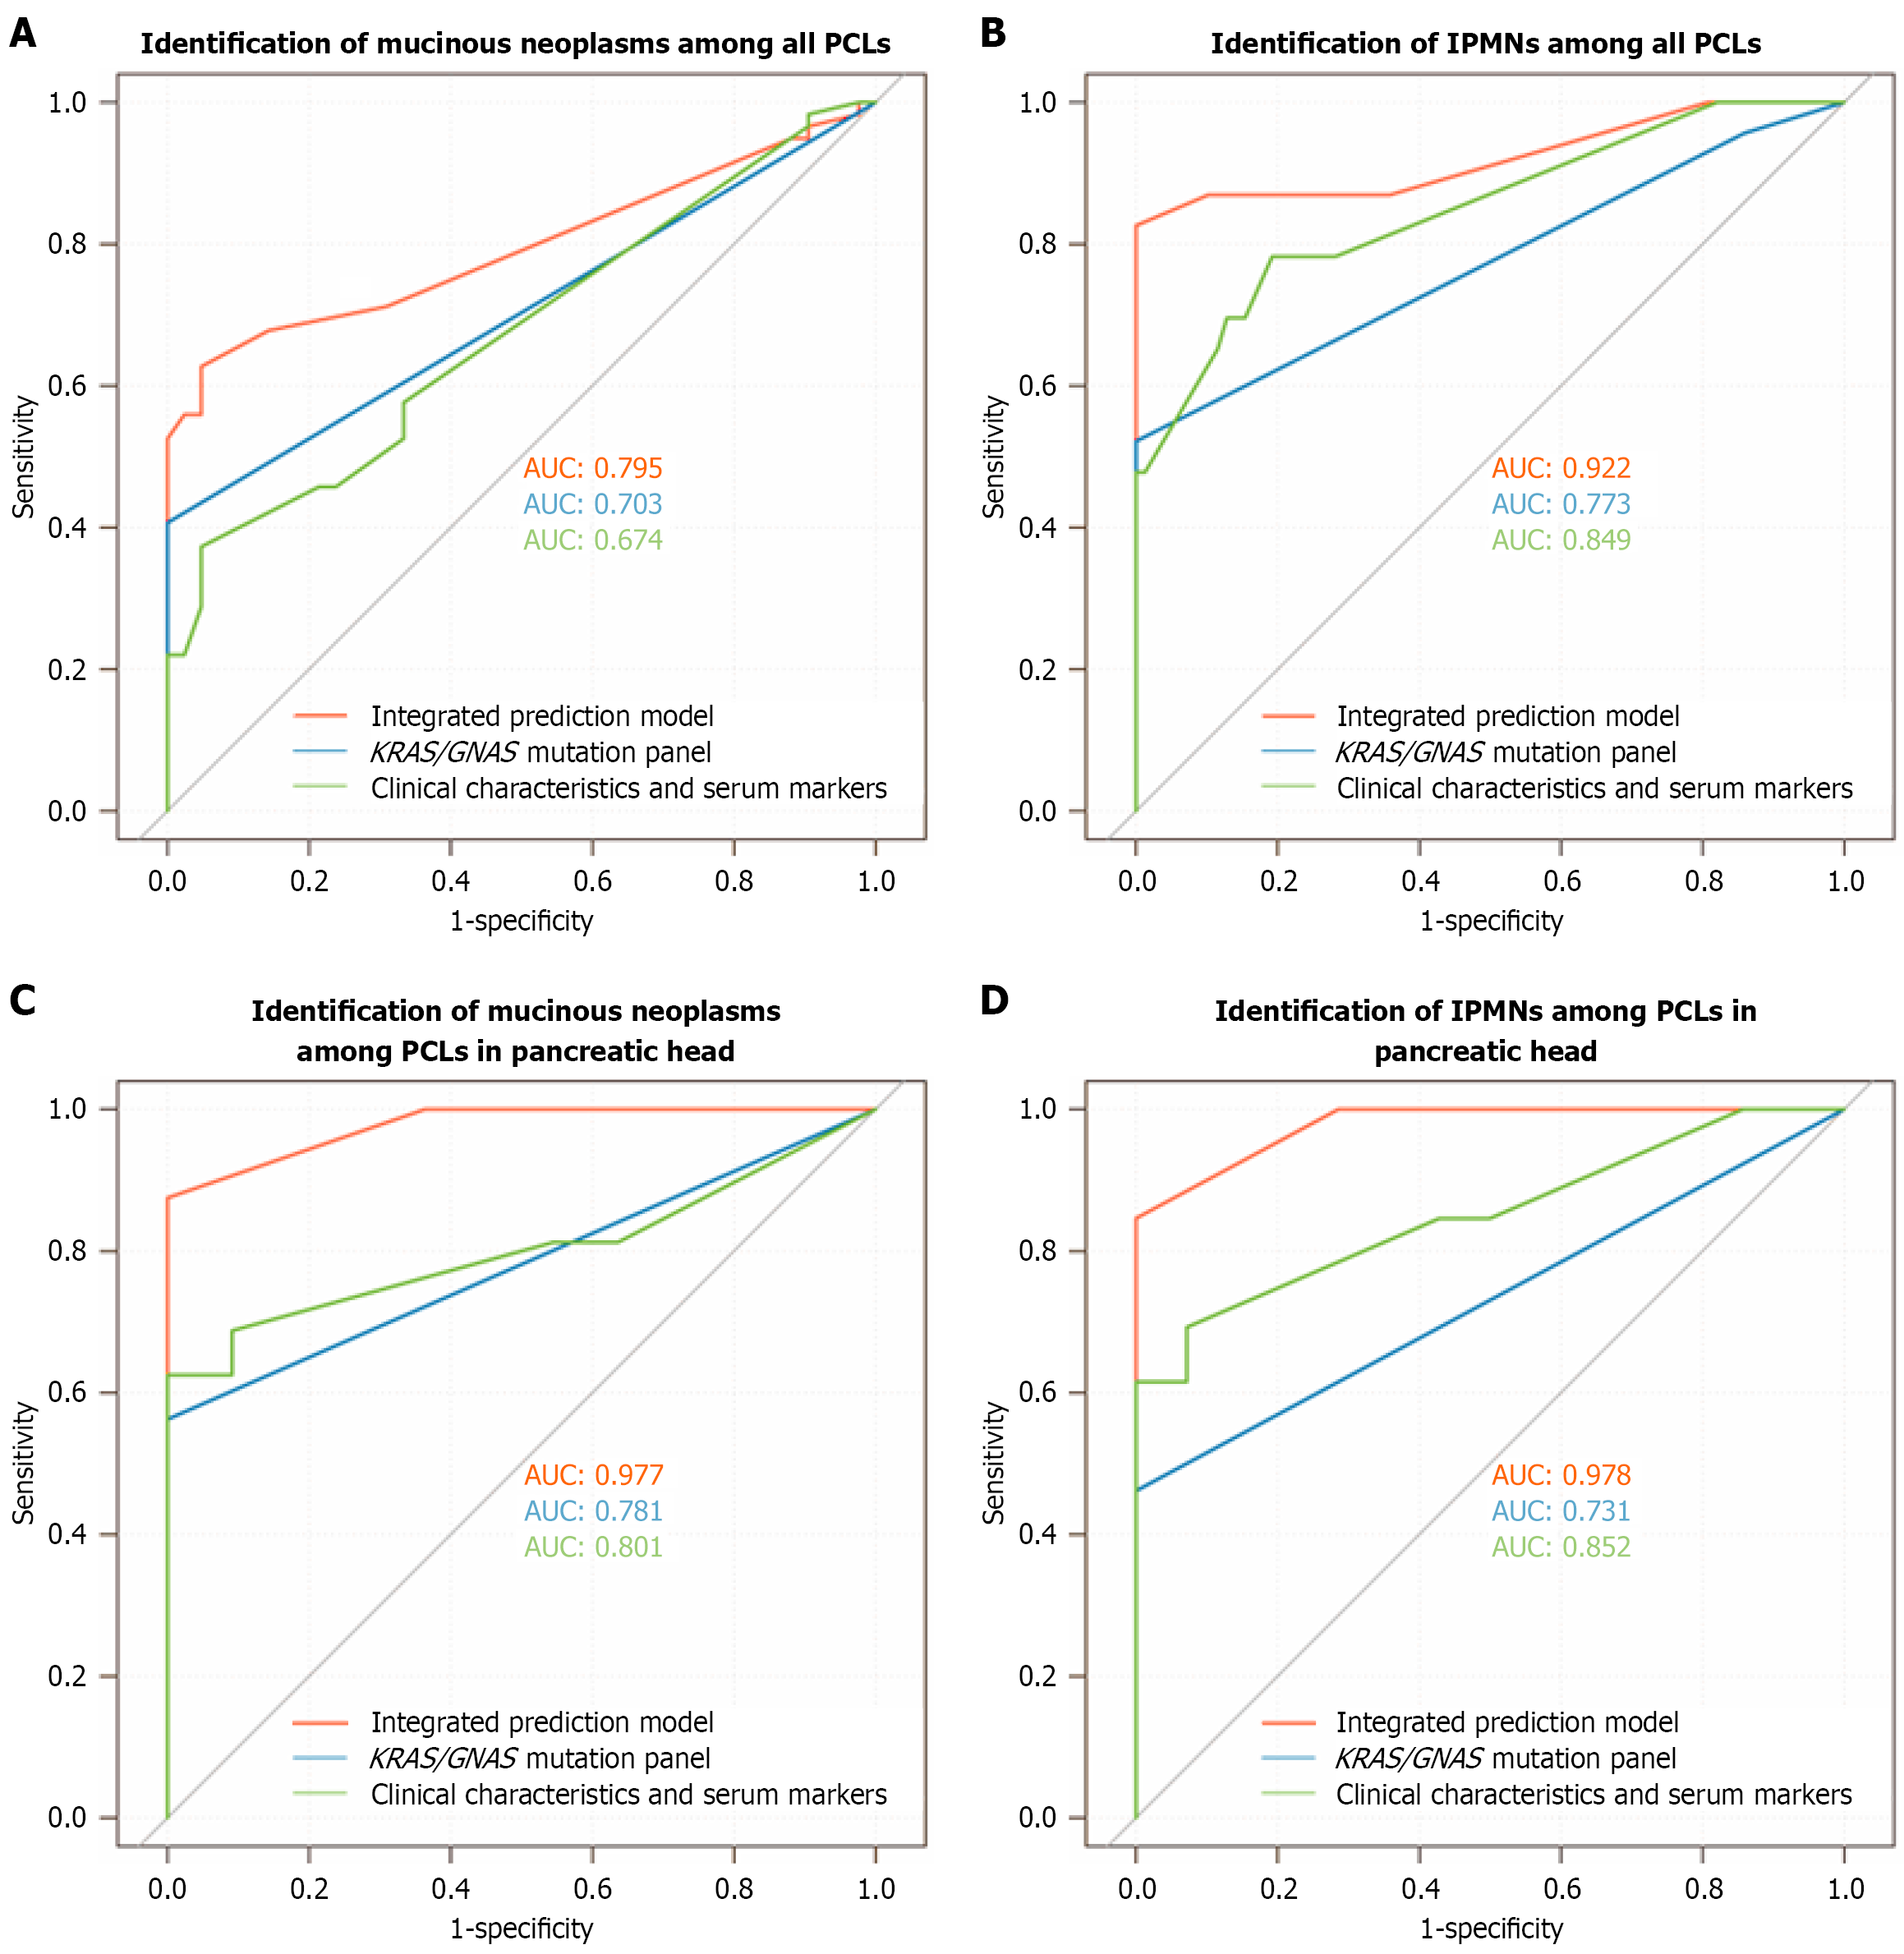
Figure 2 Receiver operating characteristic curves for identification of mucinous neoplasms and intraductal papillary mucinous neo plasms among all pancreatic cystic lesions and pancreatic cystic lesions located in the pancreatic head.
A: Among all pancreatic cystic lesions (PCLs), the integrated prediction model, KRAS and GNAS mutation status, clinical characteristics and serum markers achieved area under the curve (AUC) of 0.795, 0.703 and 0.674 for identification of mucinous neoplasms, respectively; B: For identification of intraductal papillary mucinous neoplasms (IPMNs) across all pancreatic cysts, the integrated prediction model yielded an AUC of 0.922, while KRAS and GNAS mutation status alone yielded 0.773 and clinical characteristics with serum markers yielded 0.849; C: Among pancreatic head PCLs, mucinous neoplasms detection demonstrated AUCs of 0.977 (integrated prediction model), 0.801 clinical characteristics and serum markers), and 0.781 (KRAS and GNAS mutation status); D: For IPMNs in pancreatic head cysts, AUC values reached 0.978 (integrated prediction model), 0.852 (clinical characteristics and serum markers), and 0.731 (KRAS and GNAS mutation status). PCLs: Pancreatic cystic lesions; AUC: Area under the curve; IPMNs: Intraductal papillary mucinous neoplasm.
- Citation: Diao WF, Cui M, Chen TQ, Xiao JH, Yang S, Zheng QY, Xu RY, Han XL, Hu Y. MassARRAY-based KRAS and GNAS hotspot mutation analysis of cystic fluid enables accurate classification of pancreatic cystic lesions. World J Gastroenterol 2026; 32(13): 115710
- URL: https://www.wjgnet.com/1007-9327/full/v32/i13/115710.htm
- DOI: https://dx.doi.org/10.3748/wjg.v32.i13.115710