
















Copyright: ©Author(s) 2026.
World J Gastroenterol. Apr 7, 2026; 32(13): 113985
Published online Apr 7, 2026. doi: 10.3748/wjg.v32.i13.113985
Published online Apr 7, 2026. doi: 10.3748/wjg.v32.i13.113985
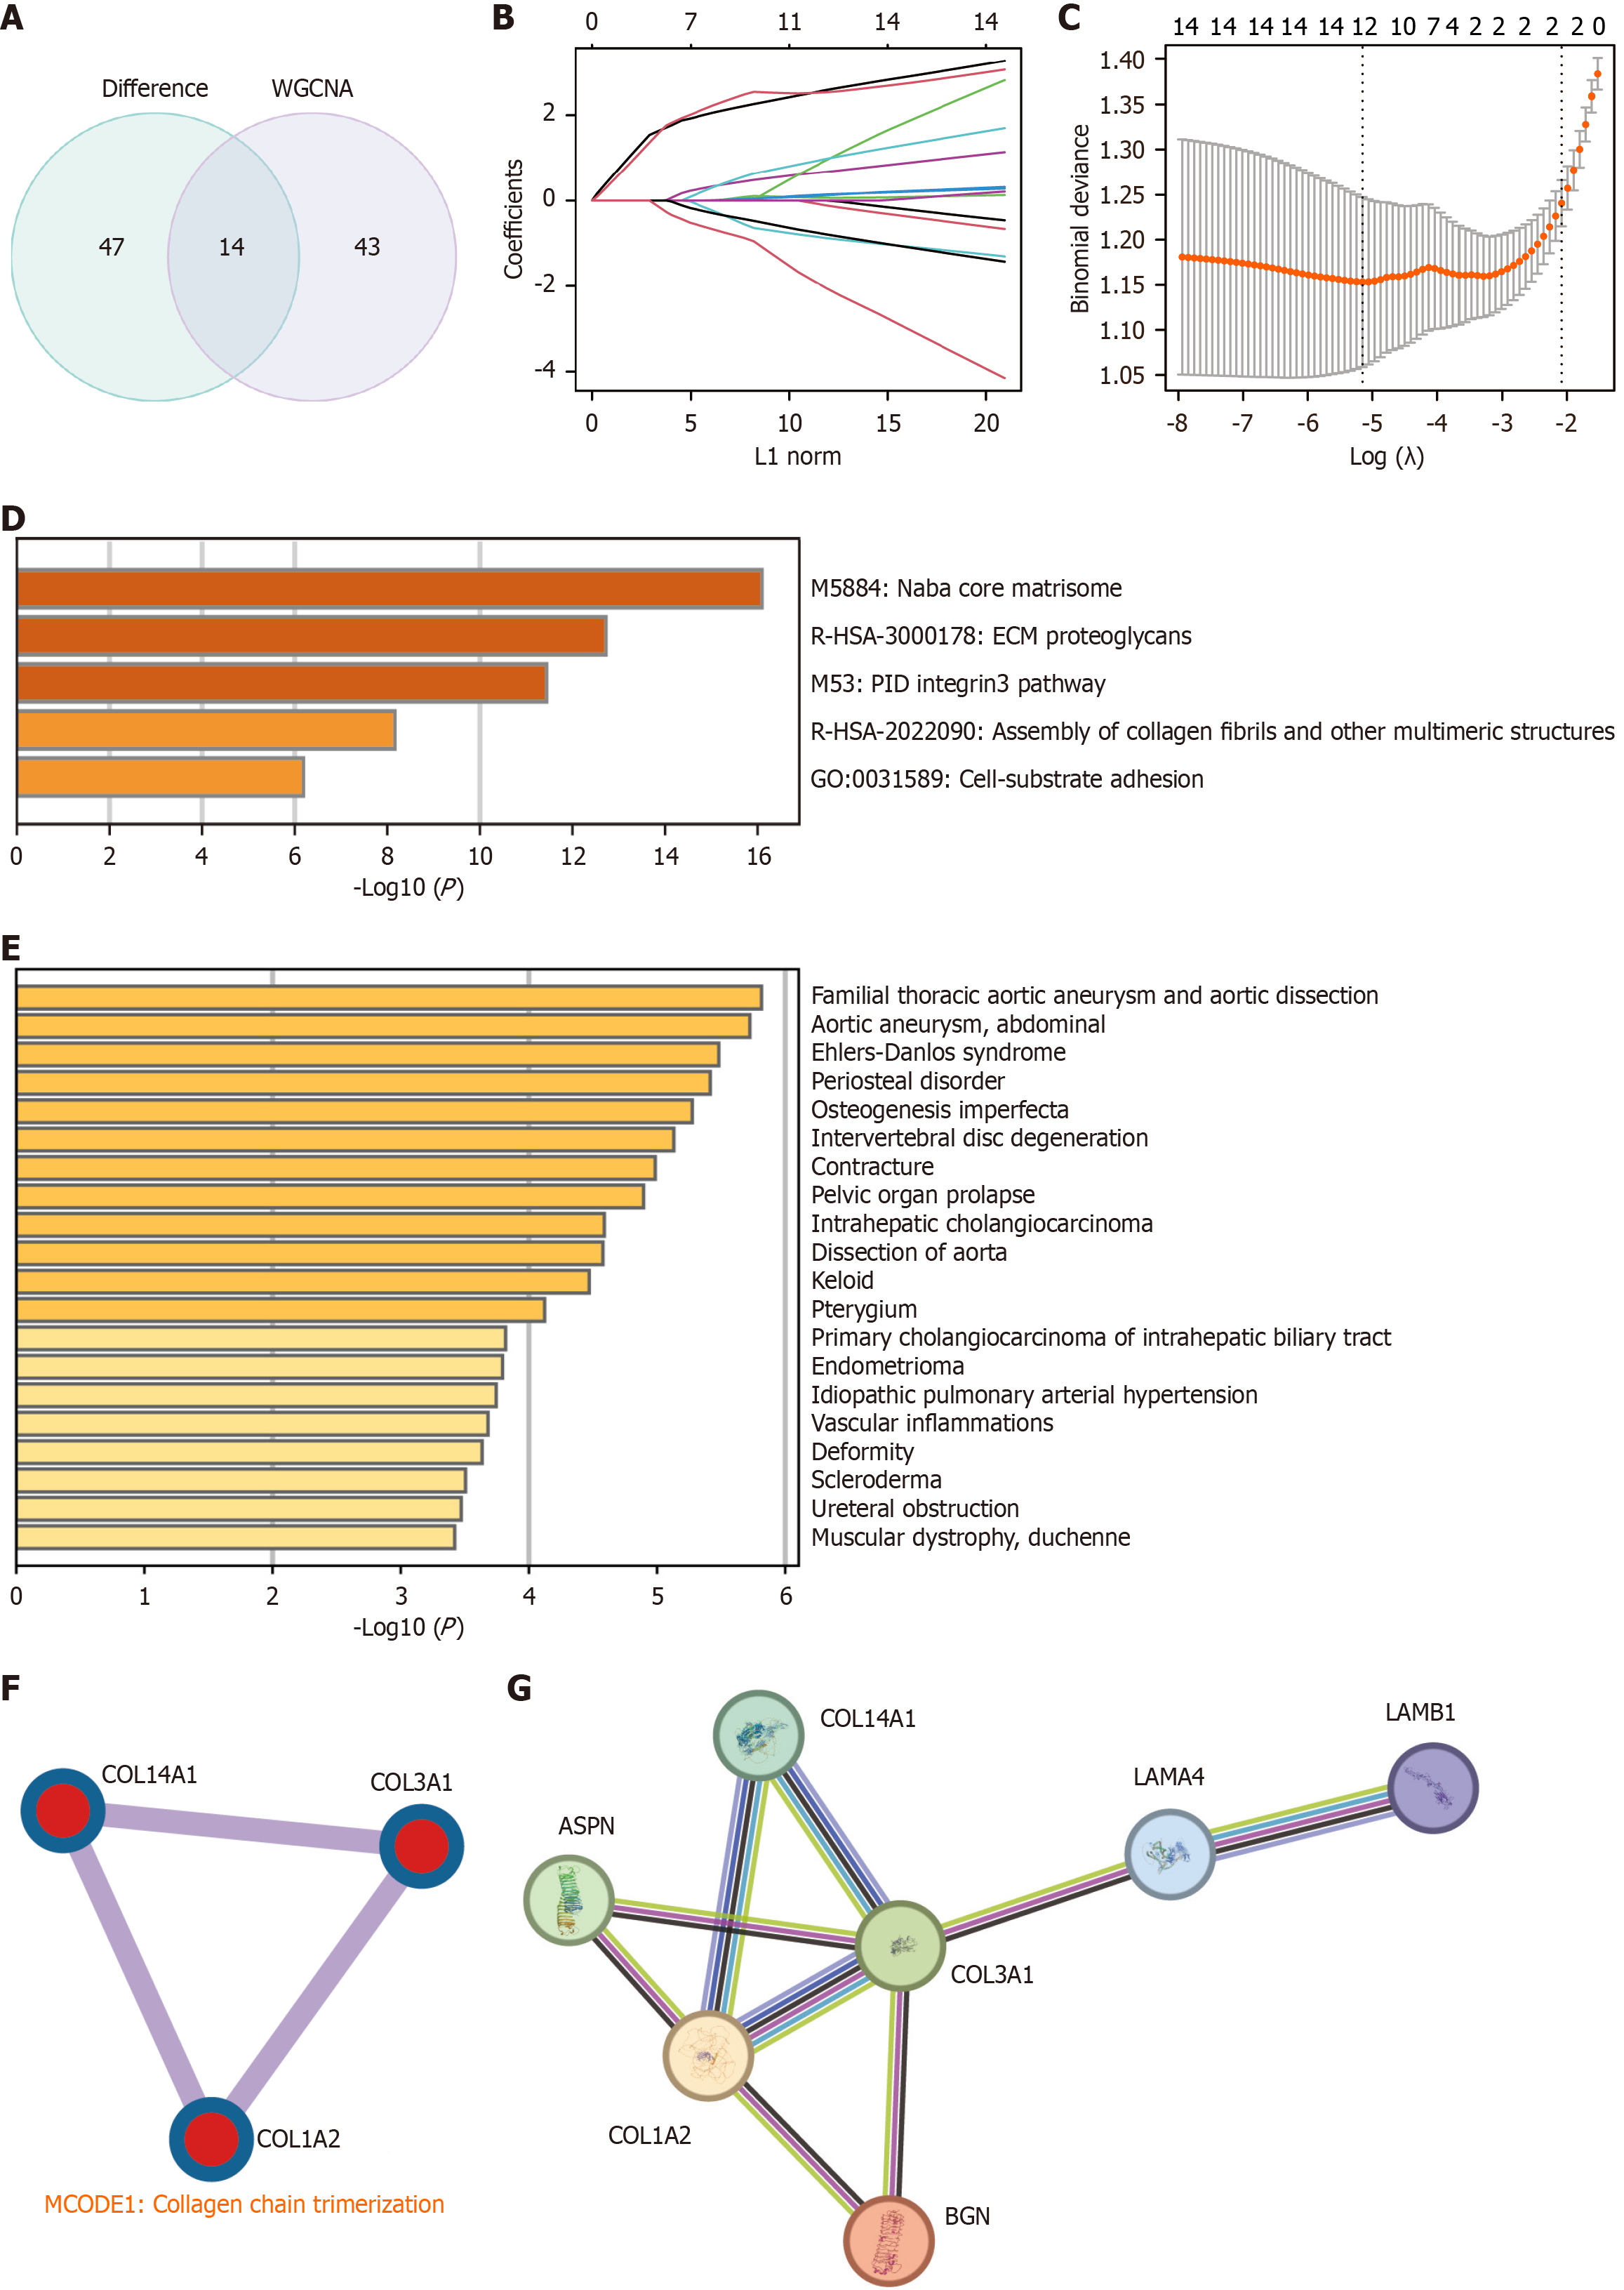
Figure 5 Identification and functional enrichment analysis of key hub genes.
A: Venn diagram showing the overlap of hub genes from differentially expressed genes and weighted gene co-expression network analysis; B and C: Identification of twelve genes through least absolute shrinkage and selection operator regression; curves represent individual genes, with the dashed line marking the optimal lambda; D: Gene Ontology (GO) enrichment analysis of hub genes, with -log10 P values on the X-axis; E: DisGeNET enrichment of hub genes, X-axis showing -log10 P values; F: Top molecular complex detection clusters of hub genes from the protein-protein interaction (PPI) network, with GO analysis highlighting key biological functions; G: PPI network of the 7 key hub genes. WGCNA: Weighted gene co-expression network analysis; GO: Gene ontology; MCODE: Molecular complex detection.
- Citation: Zhang JH, Chen K, Zhu XM, Zhou H, Jiang JM, Zou YQ, Liu KR, Zhang L, Li Y. Exercise-responsive skeletal muscle genes mechanistically linked to metabolic dysfunction-associated steatotic liver disease. World J Gastroenterol 2026; 32(13): 113985
- URL: https://www.wjgnet.com/1007-9327/full/v32/i13/113985.htm
- DOI: https://dx.doi.org/10.3748/wjg.v32.i13.113985