
















Copyright: ©Author(s) 2026.
World J Gastroenterol. Apr 7, 2026; 32(13): 113985
Published online Apr 7, 2026. doi: 10.3748/wjg.v32.i13.113985
Published online Apr 7, 2026. doi: 10.3748/wjg.v32.i13.113985
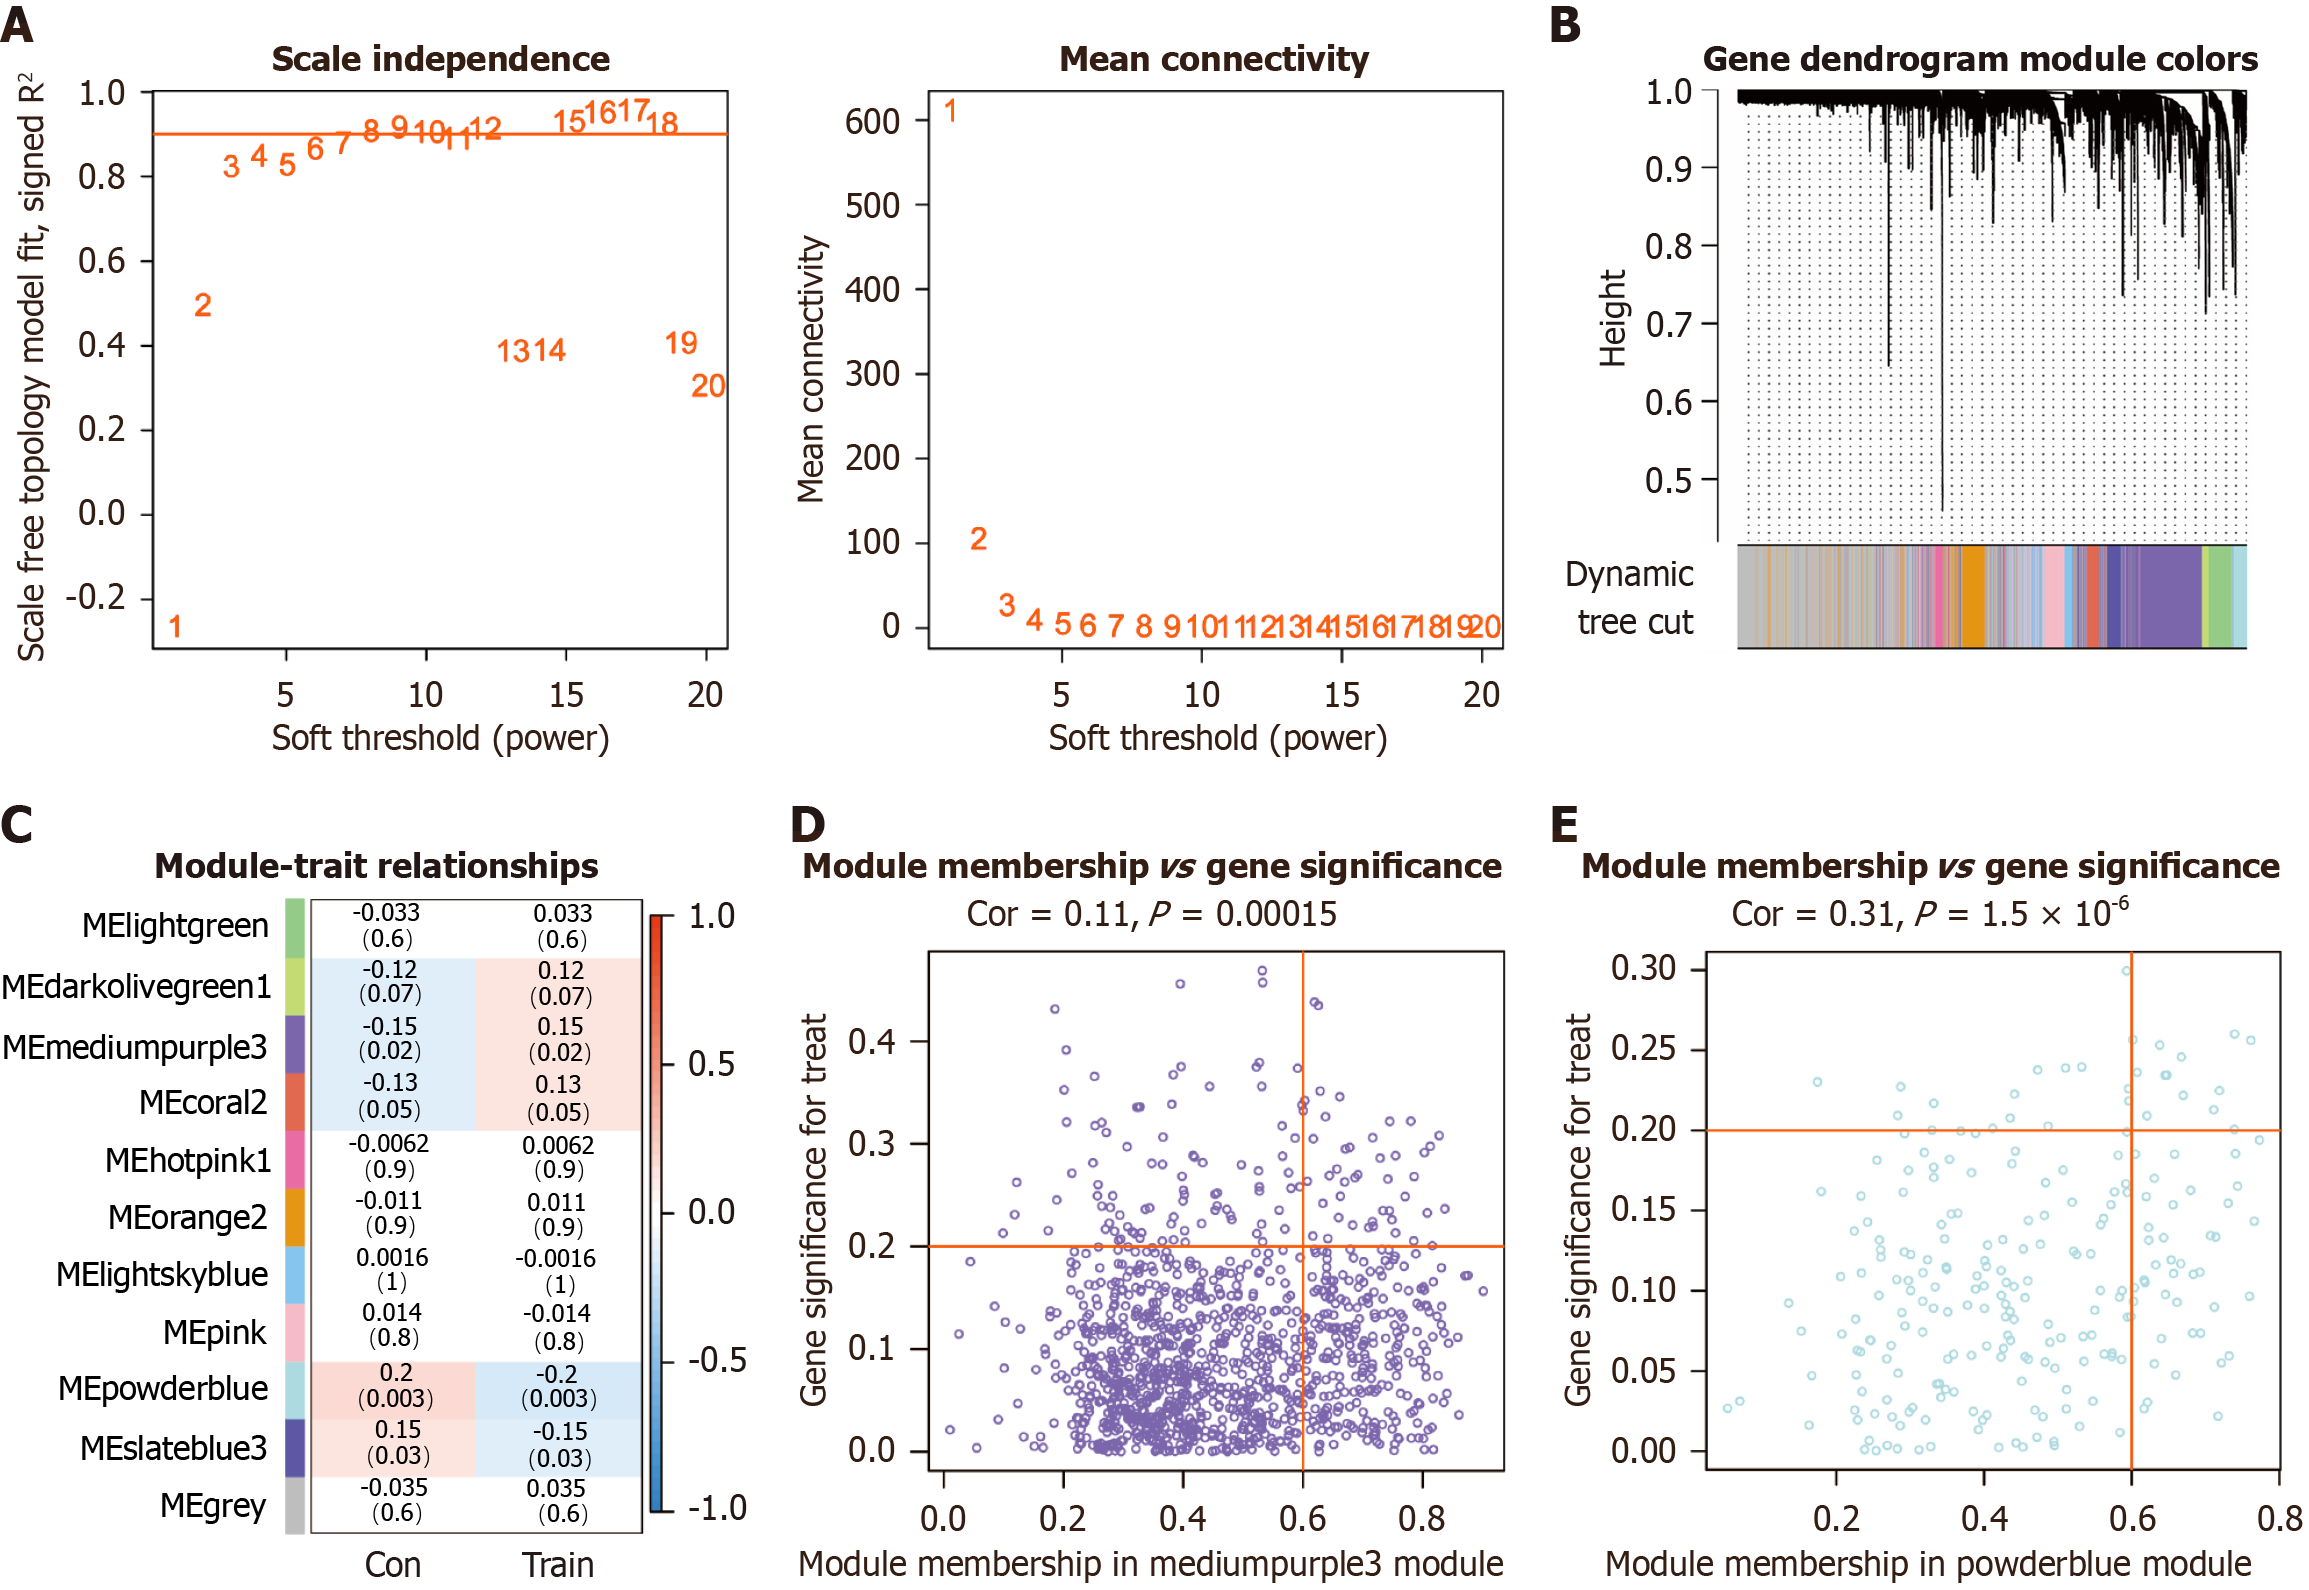
Figure 4 Weighted gene co-expression network analysis of differentially expressed genes.
A: Scale-free topology fitting index (left) and mean connectivity (right) across soft-thresholding powers (β), with the red line indicating the threshold correlation coefficient of 0.9; B: Gene clustering dendrogram constructed using the topological overlap matrix, with color bars representing an co-expression modules; C: Heatmap illustrating the correlation between module eigengenes and clinical traits in metabolic dysfunction-associated steatotic liver disease subjects before and after exercise, with positive correlations in red and negative in blue; D: Scatter plot of gene significance vs module membership in the mediumpurple3 module; E: Scatter plot of gene significance vs module membership in the powder blue module. Con: Pre-exercise; Train: Post-exercise.
- Citation: Zhang JH, Chen K, Zhu XM, Zhou H, Jiang JM, Zou YQ, Liu KR, Zhang L, Li Y. Exercise-responsive skeletal muscle genes mechanistically linked to metabolic dysfunction-associated steatotic liver disease. World J Gastroenterol 2026; 32(13): 113985
- URL: https://www.wjgnet.com/1007-9327/full/v32/i13/113985.htm
- DOI: https://dx.doi.org/10.3748/wjg.v32.i13.113985