
















Copyright: ©Author(s) 2026.
World J Gastroenterol. Apr 7, 2026; 32(13): 113985
Published online Apr 7, 2026. doi: 10.3748/wjg.v32.i13.113985
Published online Apr 7, 2026. doi: 10.3748/wjg.v32.i13.113985
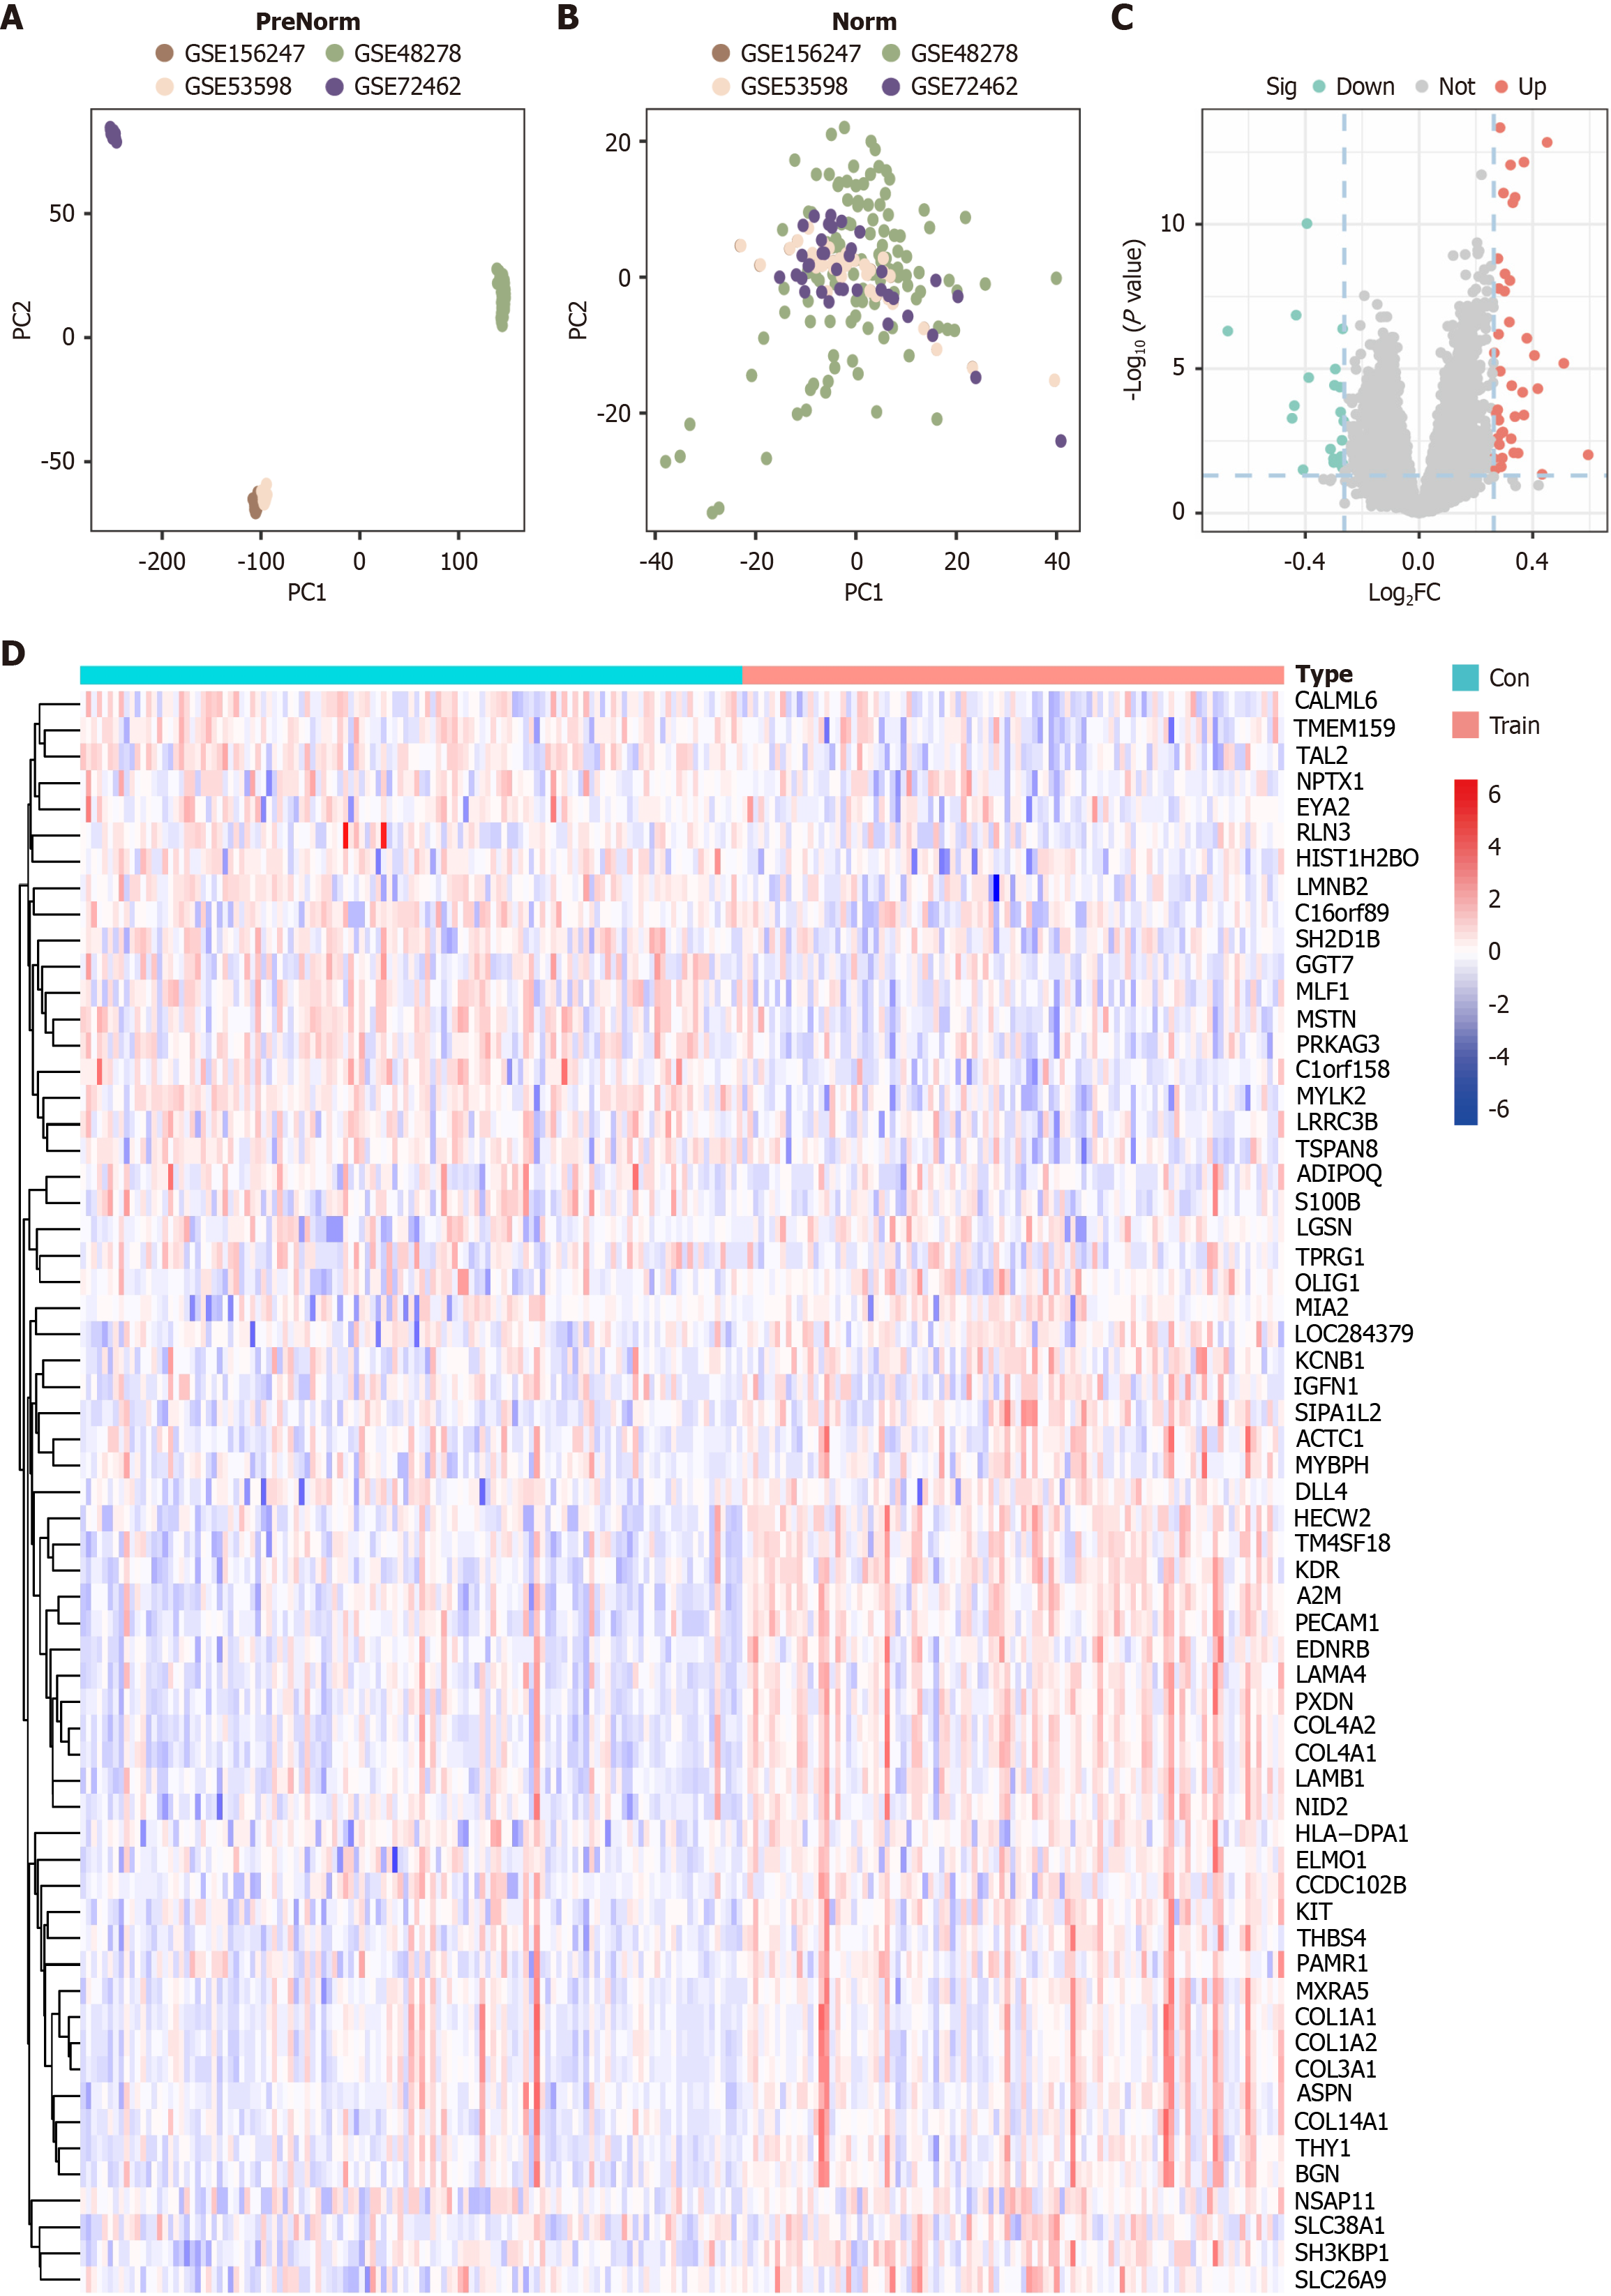
Figure 2 Identification of differentially expressed genes in muscle tissue samples.
A and B: Principal component analysis of different gene expression omnibus datasets. The gene expression profiles were visualized using scatter plots based on the first two principal components with (B) and without (A) batch effect correction; C: Volcano plots of the differentially expressed genes (DEGs); D: Heatmap showing DEGs between pre-exercise and post-exercise samples. PC1: Principal components 1; PC2: Principal components 2; FC: Fold change; Sig: Significance; Down: Down-regulation; Not: Not significant; Up: Up-regulation; Con: Pre-exercise; Train: Post-exercise.
- Citation: Zhang JH, Chen K, Zhu XM, Zhou H, Jiang JM, Zou YQ, Liu KR, Zhang L, Li Y. Exercise-responsive skeletal muscle genes mechanistically linked to metabolic dysfunction-associated steatotic liver disease. World J Gastroenterol 2026; 32(13): 113985
- URL: https://www.wjgnet.com/1007-9327/full/v32/i13/113985.htm
- DOI: https://dx.doi.org/10.3748/wjg.v32.i13.113985