
















Copyright: ©Author(s) 2026.
World J Gastroenterol. Mar 28, 2026; 32(12): 116287
Published online Mar 28, 2026. doi: 10.3748/wjg.v32.i12.116287
Published online Mar 28, 2026. doi: 10.3748/wjg.v32.i12.116287
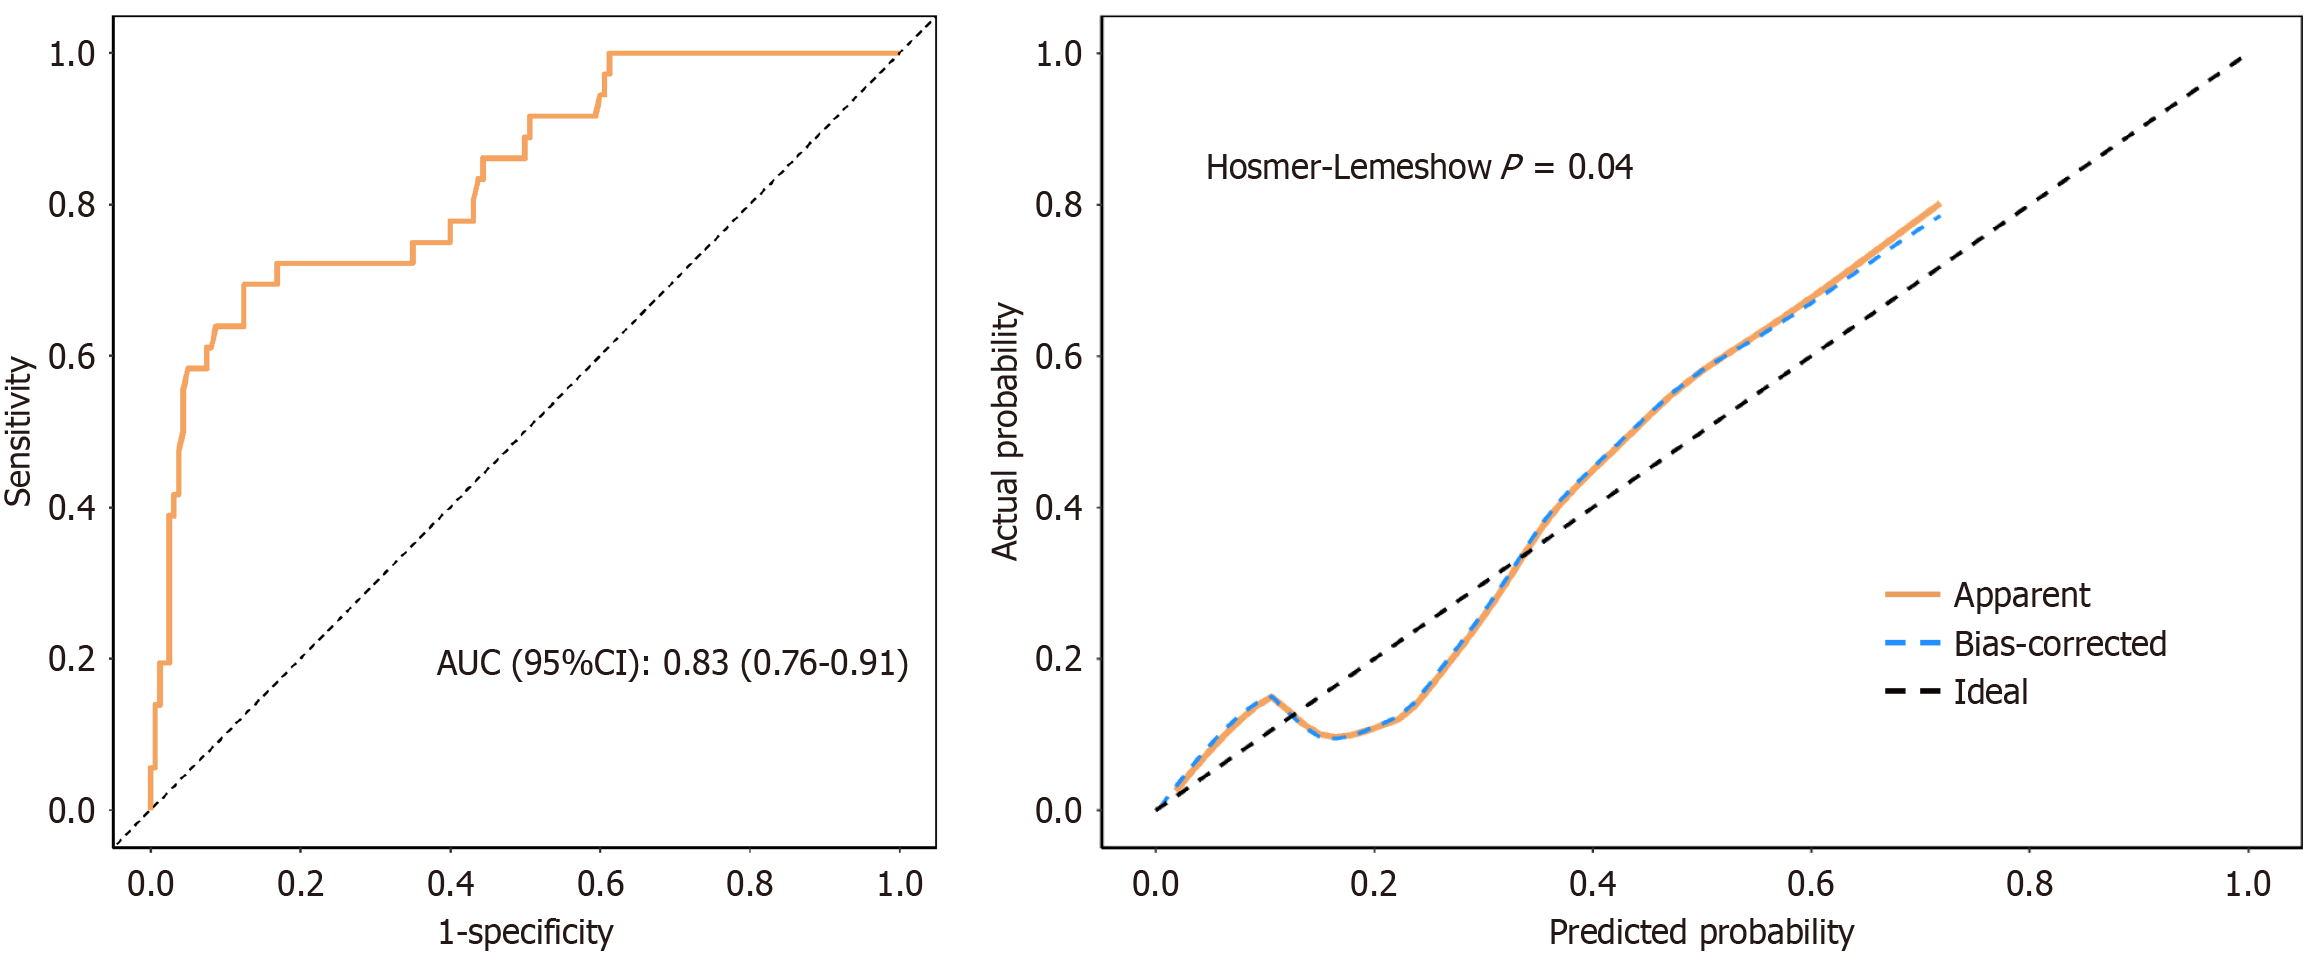
Figure 4 Receiver operating characteristic curve and calibration curve of the training cohort.
The area under the curve was 0.83 (95% confidence interval: 0.76-0.91), with a sensitivity of 0.88 and specificity of 0.69. The result of Hosmer-Lemeshow goodness-of-fit test for the training cohort was χ2 = 16.30, P = 0.04. AUC: Area under the curve; CI: Confidence interval.
- Citation: Yan F, Xue XL, Guo Y, Zhang QR, You RR, Shang J, Wu XP, Geng JW, Gao XH, Ye Q, Liang J, Wang XY, Zeng JY, Chen J, Lin YC, Chen XY, Du Q, Yin WL, Liu L, Wang F, Xu BG, Zhang WH, Xiang HL. Baseline hepatitis B surface antigen and cirrhosis predict extended interferon therapy in chronic hepatitis B: A retrospective study. World J Gastroenterol 2026; 32(12): 116287
- URL: https://www.wjgnet.com/1007-9327/full/v32/i12/116287.htm
- DOI: https://dx.doi.org/10.3748/wjg.v32.i12.116287