
















©Author(s) (or their employer(s)) 2026.
World J Gastroenterol. Mar 14, 2026; 32(10): 115957
Published online Mar 14, 2026. doi: 10.3748/wjg.v32.i10.115957
Published online Mar 14, 2026. doi: 10.3748/wjg.v32.i10.115957
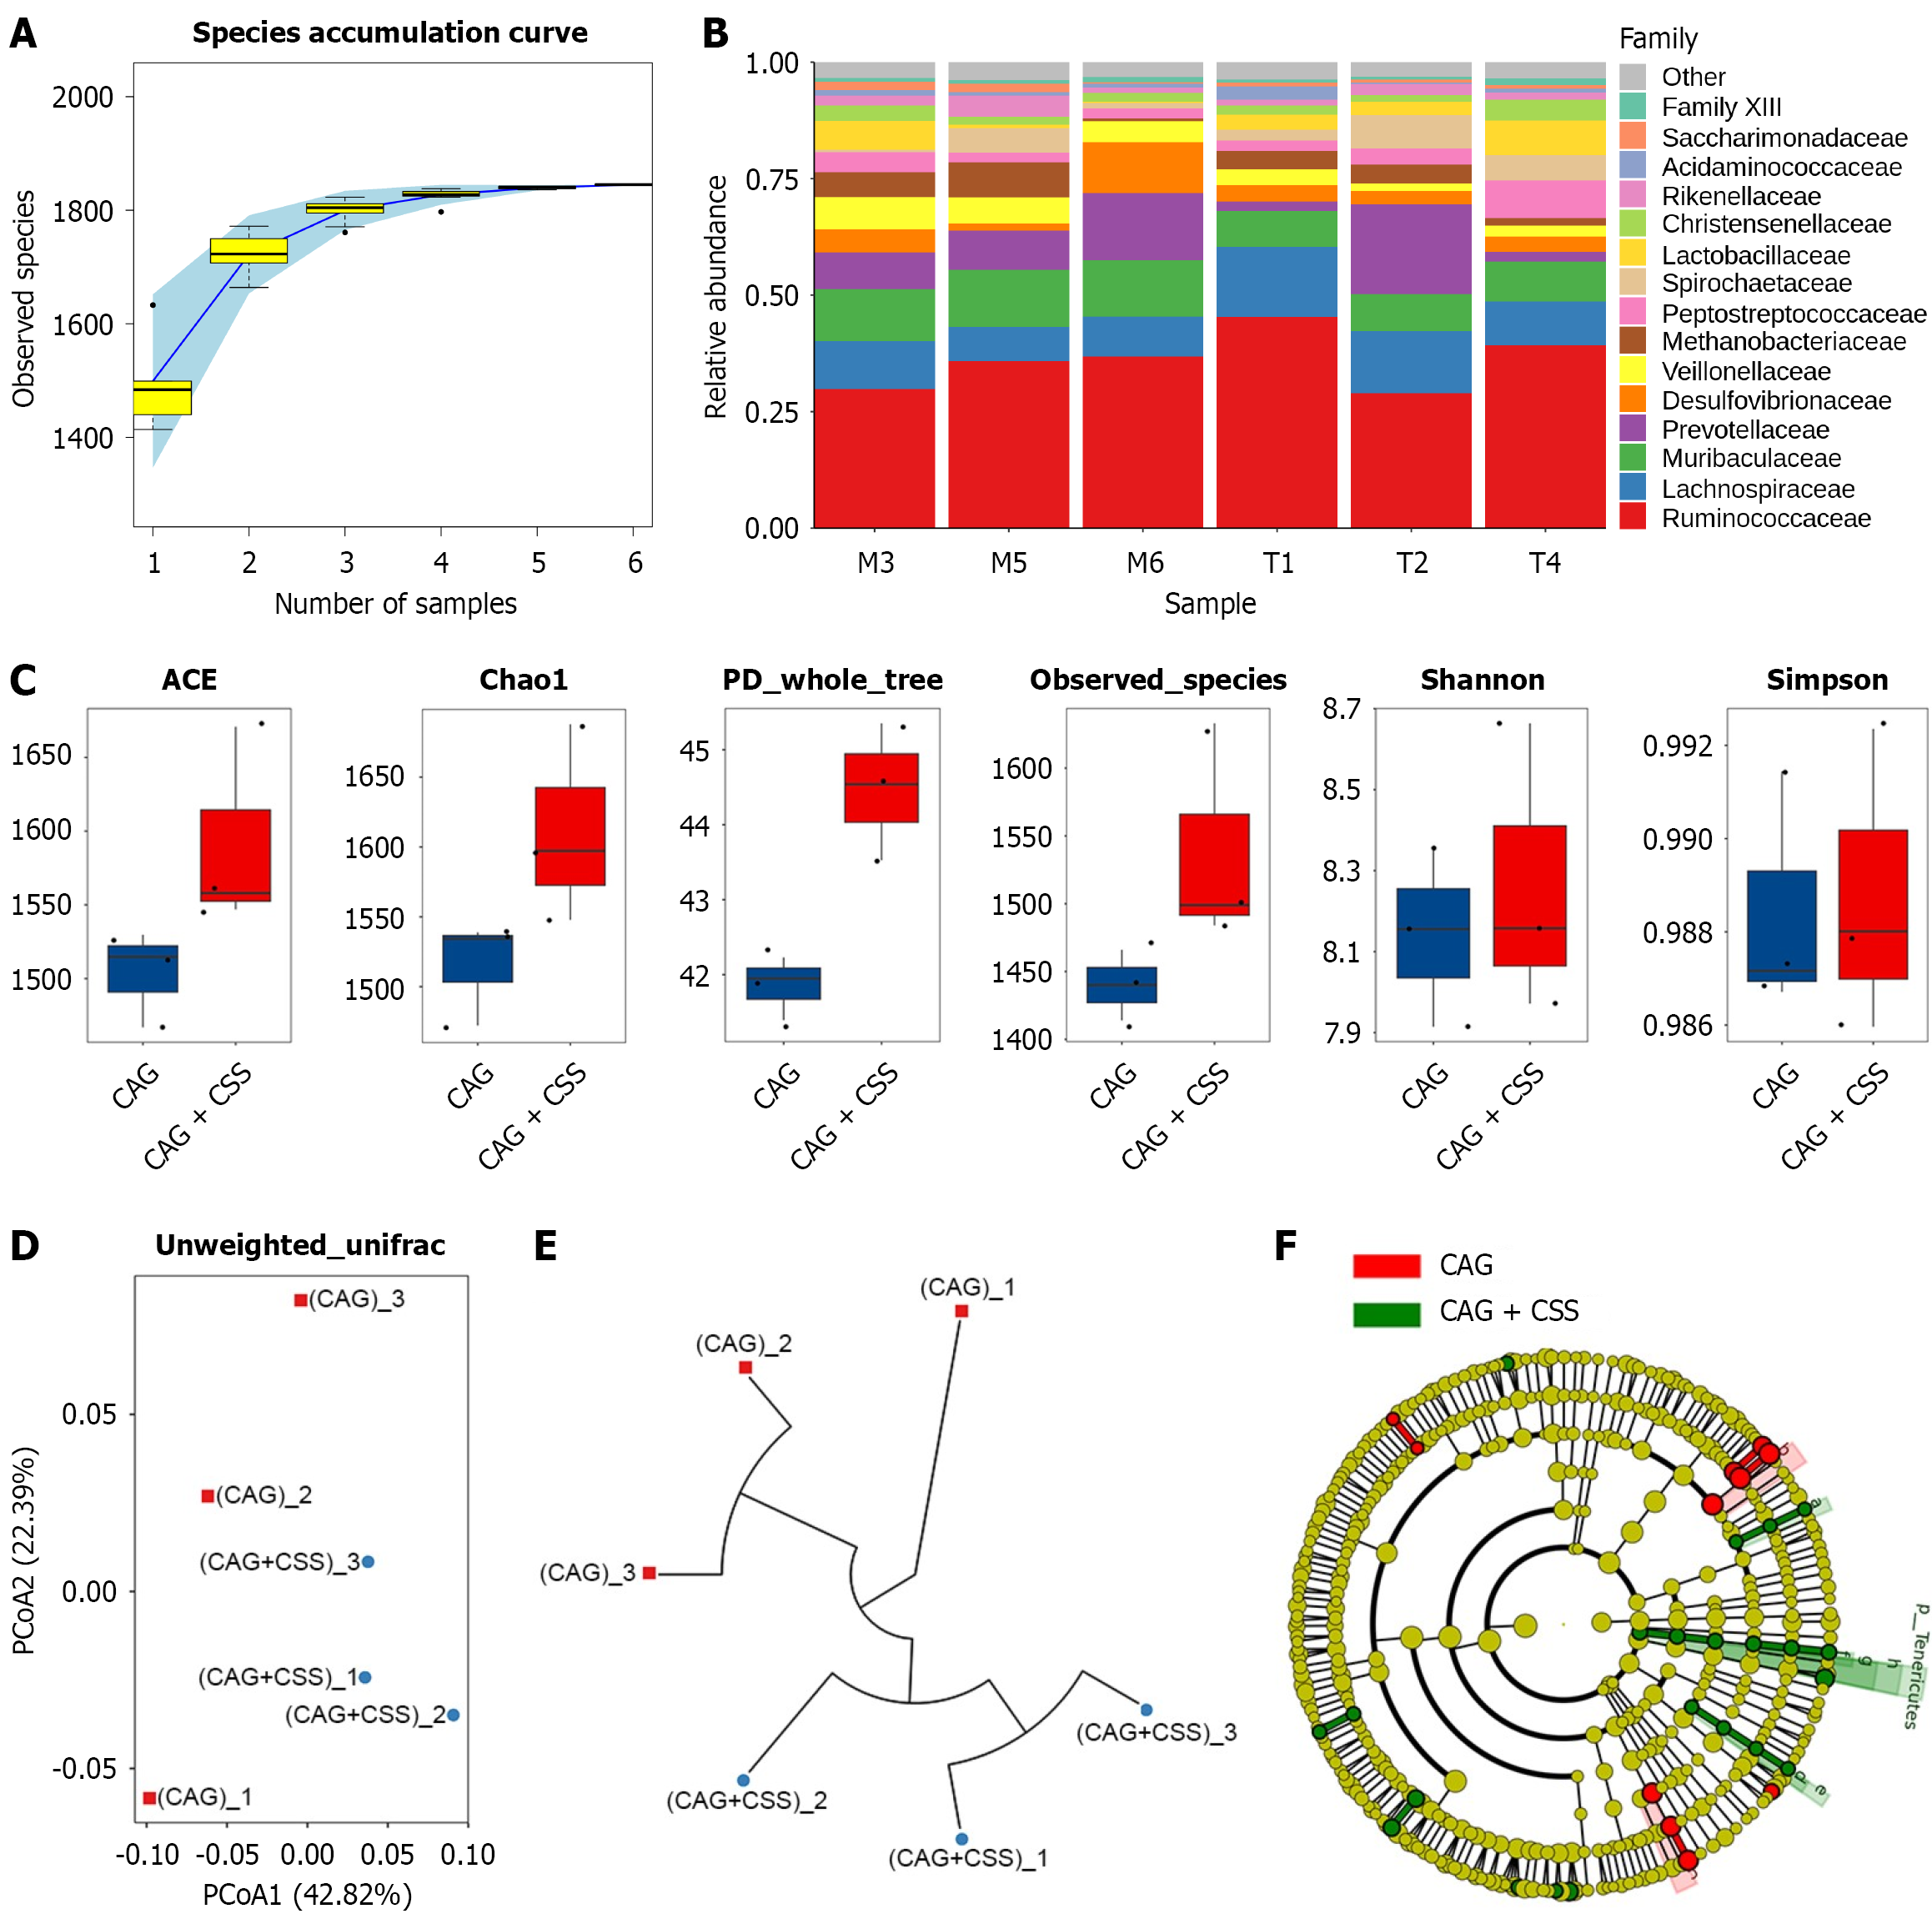
Figure 7 Effects of Chaihu-Shugan-San on gut microbiome in methyl-N’-nitro-N-nitrosoguanidine-treated rats.
A: Species accumulation curve estimates the rationality of sequencing sample quantity; B: Community histogram shows the compositional discrepancy at family level; C: Analysis of differences in the α-diversity indexes ACE, Chao1, phylogenetic diversity whole tree, observed species, Shannon and Simpson; D and E: Analysis of differences in the β-diversity index, as determined by principal coordinate analysis (D) and hierarchical cluster tree (E); F: Cladogram of linear discriminant analysis effect size (n = 3). PD: Phylogenetic diversity; CAG: Chronic atrophic gastritis; CSS: Chaihu-Shugan-San; PCoA: Principal coordinates analysis.
- Citation: Song J, Li DY, Zhang XL, He SS, Wang N, Zhang HC, Bai YJ, Li B, Zhang SS. Chaihu-Shugan-San ameliorates chronic atrophic gastritis by inhibiting nuclear factor-kappa B-mediated inflammation and apoptosis. World J Gastroenterol 2026; 32(10): 115957
- URL: https://www.wjgnet.com/1007-9327/full/v32/i10/115957.htm
- DOI: https://dx.doi.org/10.3748/wjg.v32.i10.115957