
















©Author(s) (or their employer(s)) 2026.
World J Gastroenterol. Mar 14, 2026; 32(10): 115957
Published online Mar 14, 2026. doi: 10.3748/wjg.v32.i10.115957
Published online Mar 14, 2026. doi: 10.3748/wjg.v32.i10.115957
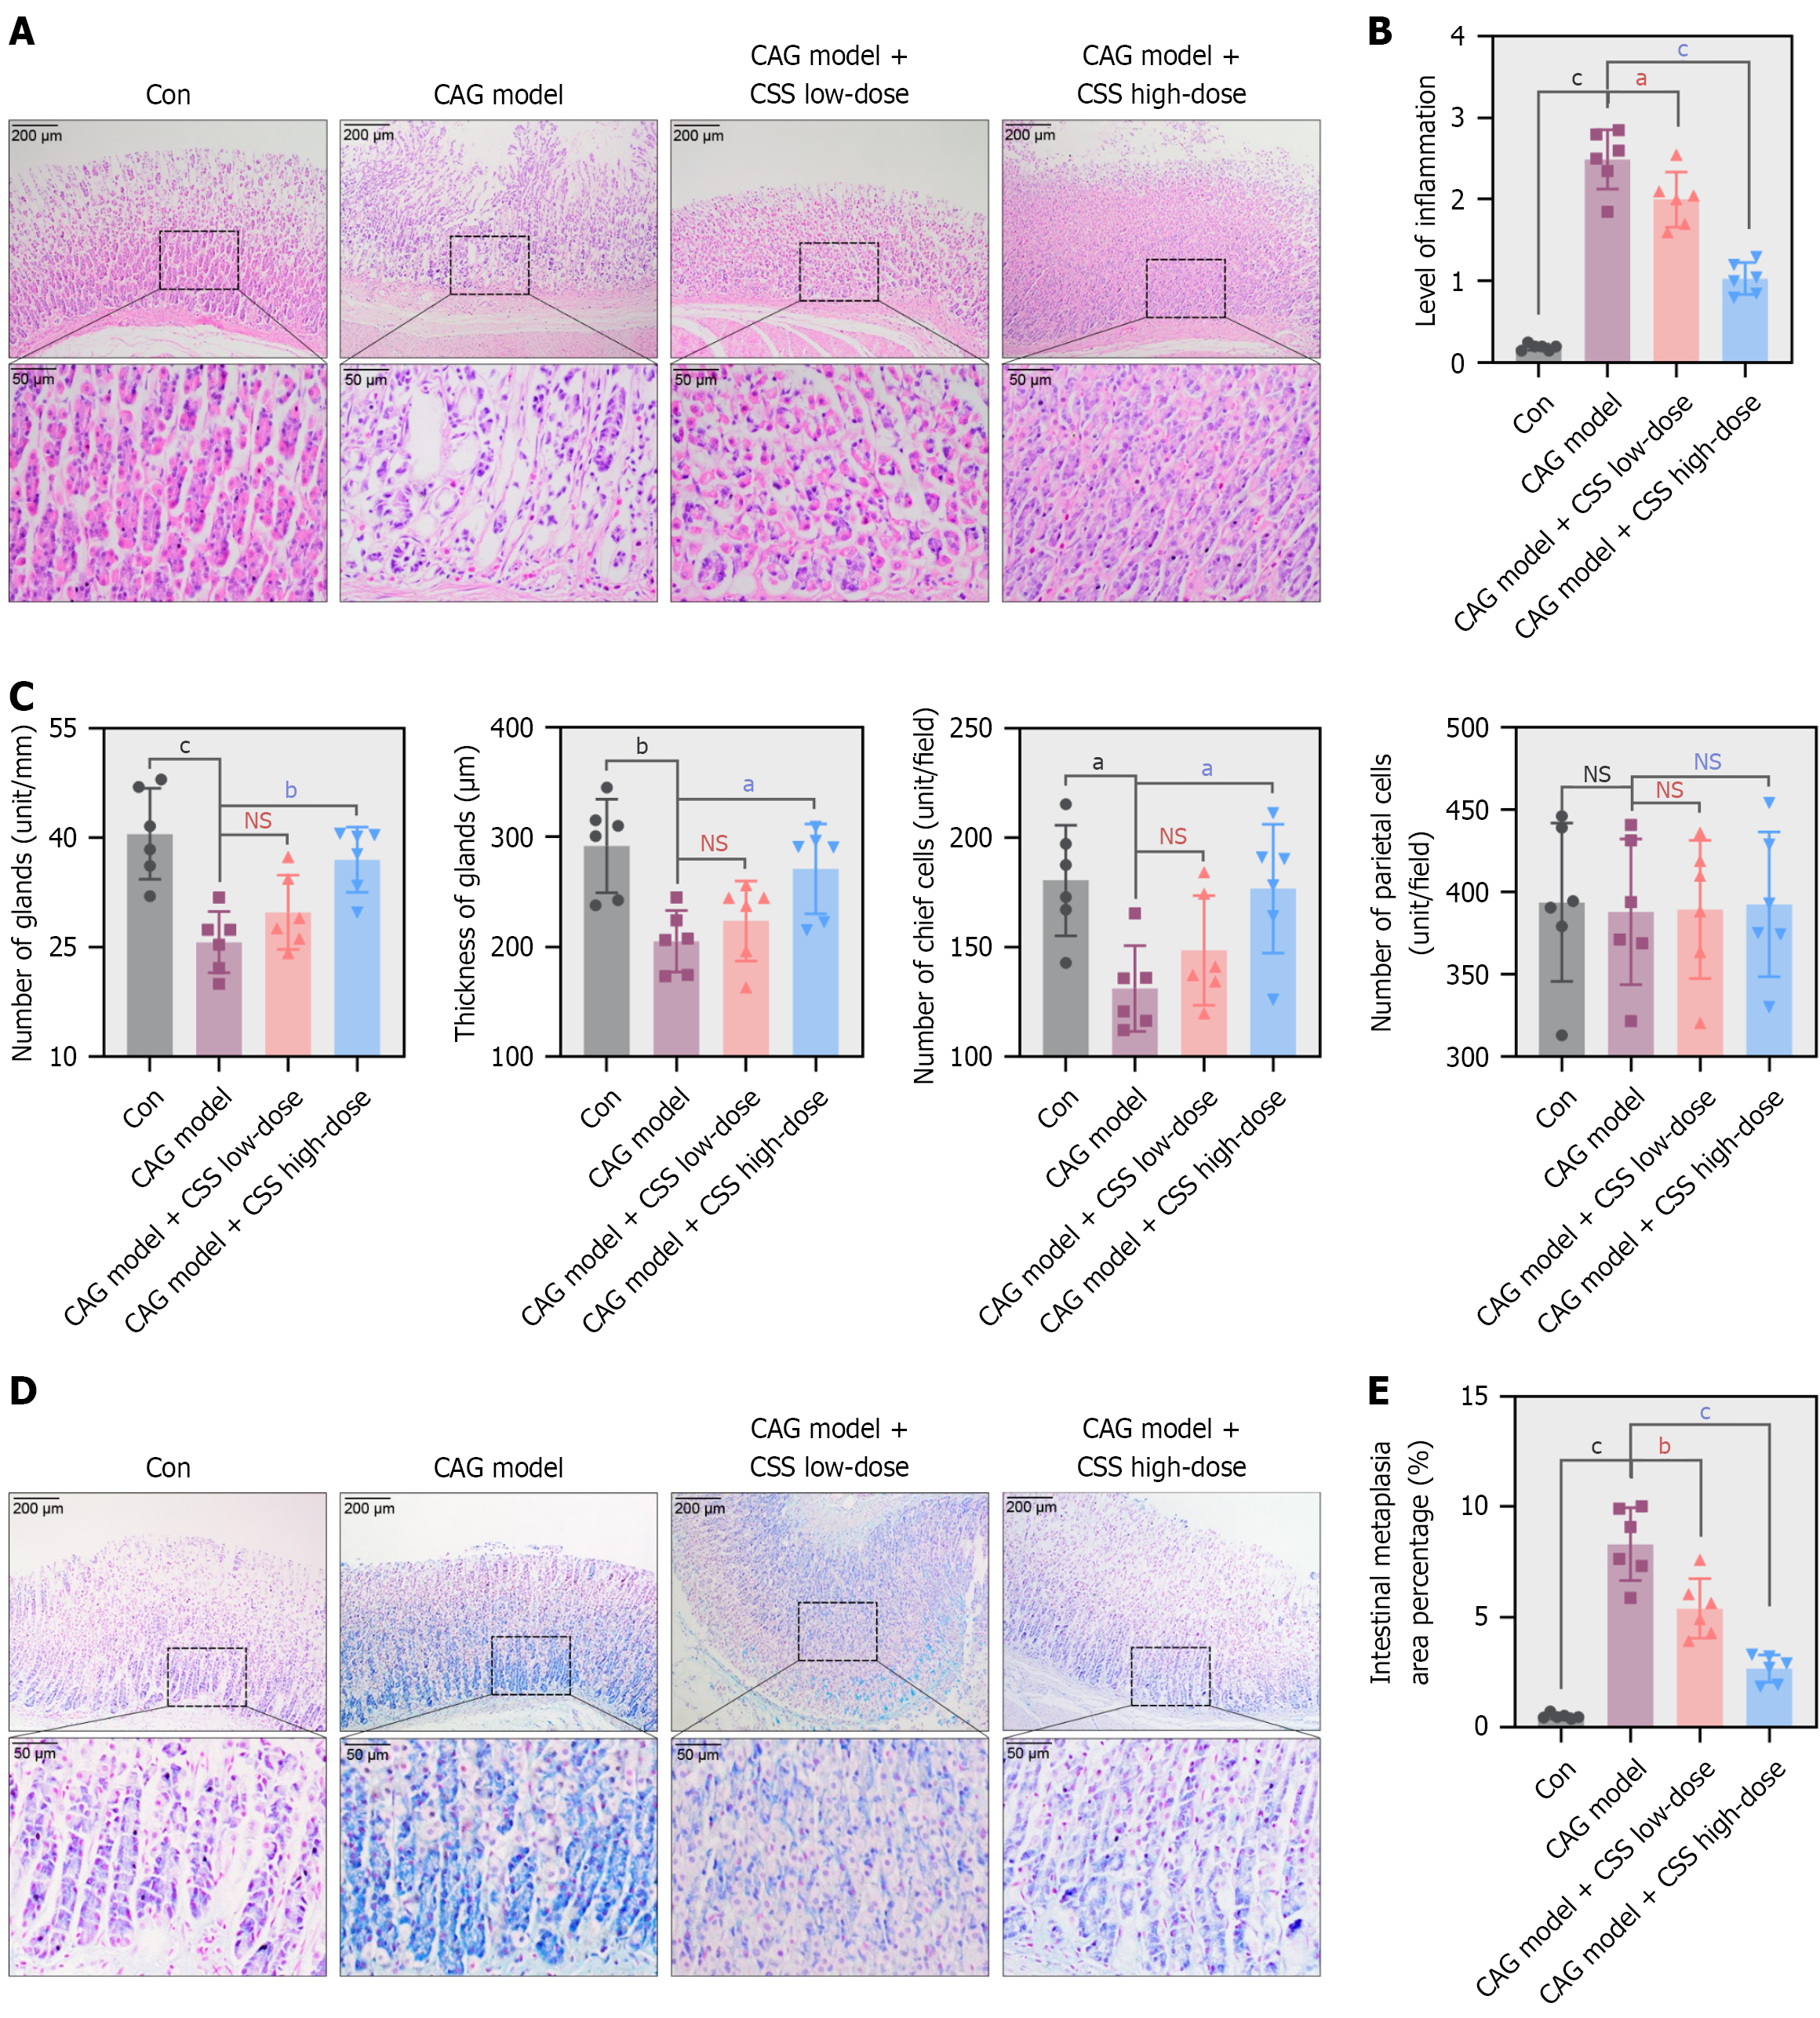
Figure 3 Effects of Chaihu-Shugan-San on histopathological changes of the gastric mucosa in methyl-N’-nitro-N-nitrosoguanidine-treated rats.
A: Representative photomicrographs for hematoxylin and eosin staining of the gastric mucosa of rats. Upper: Scale bar = 200 μm. Lower: Scale bar = 50 μm; B: Quantification of inflammation score; C: Quantitation of the number of gastric glands, thickness of gastric glands, number of gastric chief cells, and number of gastric parietal cells; D: Representative photomicrographs for alcian blue staining of the gastric mucosa. Upper: Scale bar = 200 μm. Lower: Scale bar = 50 μm; E: Quantitative analysis of intestinal metaplasia of gastric mucosa. Data are shown as mean ± SD (n = 6). Differences were analyzed by one-way analysis of variance followed by Tukey’s post-hoc test. aP < 0.05. bP < 0.01. cP < 0.001. P values vs chronic atrophic gastritis model group. NS: No significance; CAG: Chronic atrophic gastritis; CSS: Chaihu-Shugan-San; Con: Control.
- Citation: Song J, Li DY, Zhang XL, He SS, Wang N, Zhang HC, Bai YJ, Li B, Zhang SS. Chaihu-Shugan-San ameliorates chronic atrophic gastritis by inhibiting nuclear factor-kappa B-mediated inflammation and apoptosis. World J Gastroenterol 2026; 32(10): 115957
- URL: https://www.wjgnet.com/1007-9327/full/v32/i10/115957.htm
- DOI: https://dx.doi.org/10.3748/wjg.v32.i10.115957