
















©Author(s) (or their employer(s)) 2026.
World J Gastroenterol. Mar 14, 2026; 32(10): 115167
Published online Mar 14, 2026. doi: 10.3748/wjg.v32.i10.115167
Published online Mar 14, 2026. doi: 10.3748/wjg.v32.i10.115167
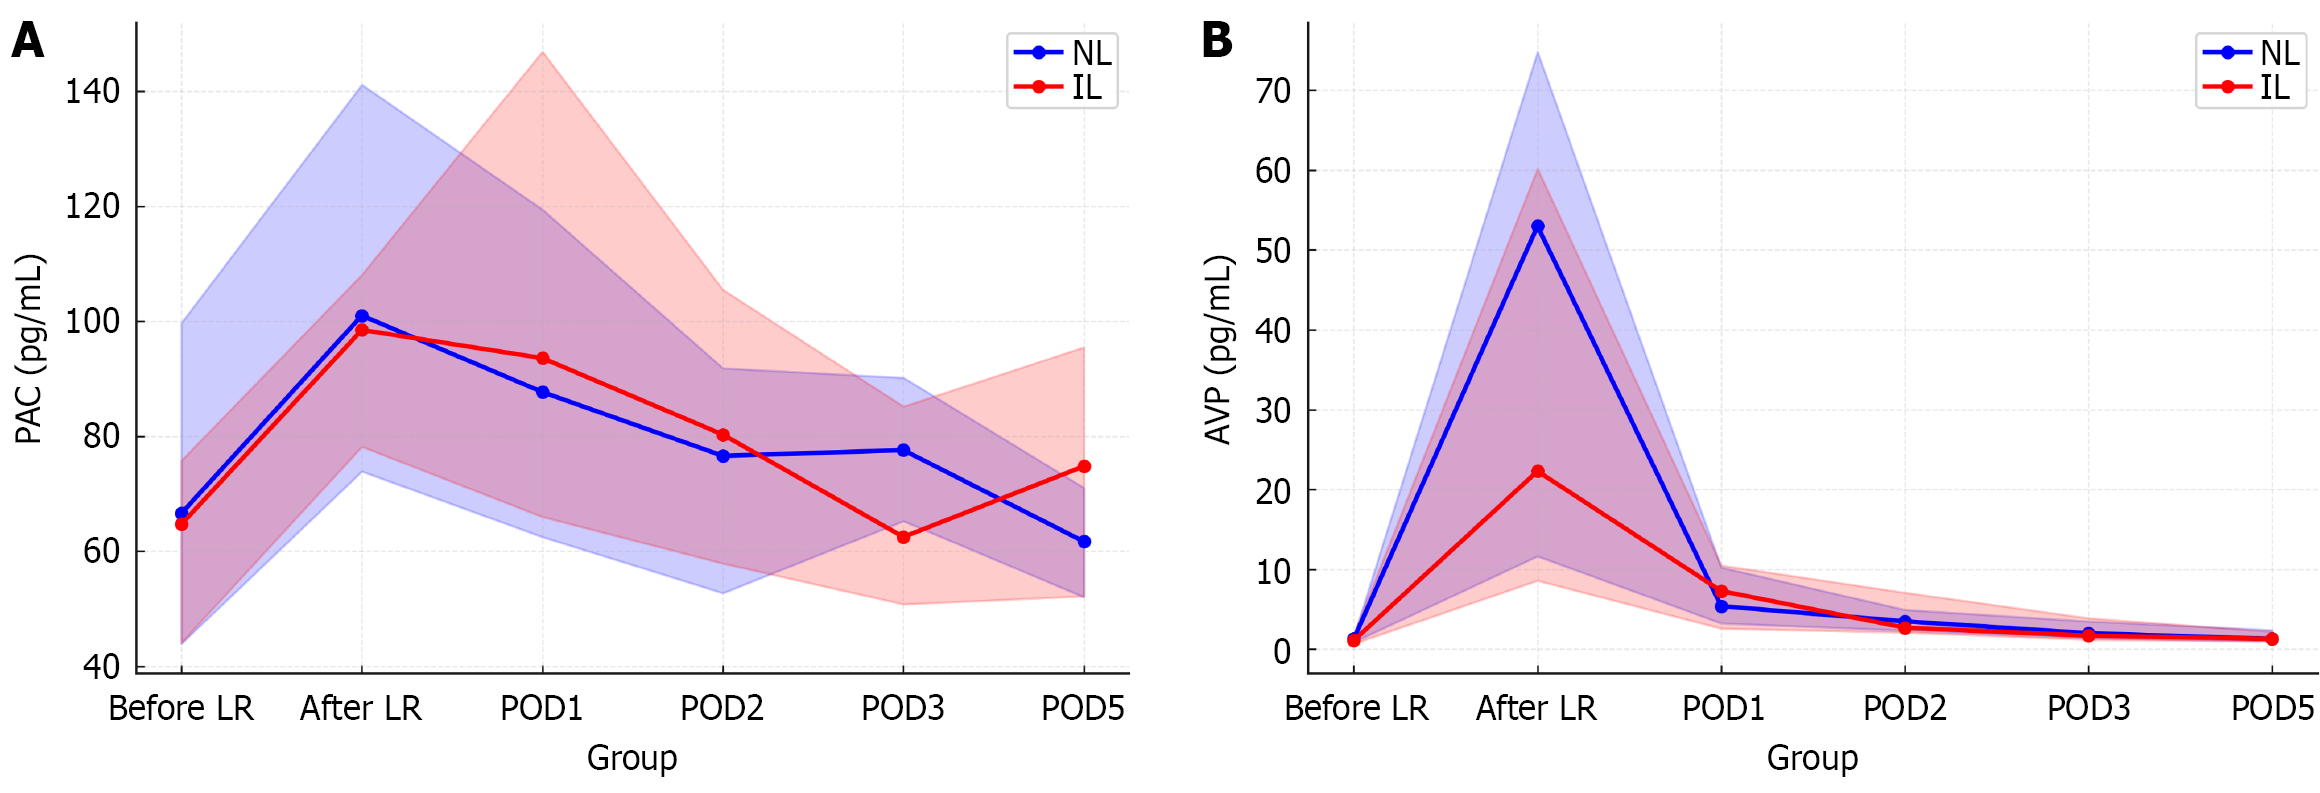
Figure 2 Comparison of plasma aldosterone concentration and arginine vasopressin dynamics by liver function.
A and B: Changes in plasma aldosterone concentration (PAC) (A) and arginine vasopressin (AVP) (B) in patients with normal liver (NL) (blue line) and impaired liver (IL) (red line), stratified by the indocyanine green retention rate at 15 minutes (< 10% = NL; ≥ 10% = IL). Both groups exhibited postoperative elevations in PAC and AVP with no significant intergroup differences at any time point. Values are expressed as medians with interquartile ranges. NL: Normal liver; IL: Impaired liver; PAC: Plasma aldosterone concentration; AVP: Arginine vasopressin; LR: Liver resection; POD: Postoperative day.
- Citation: Aoki Y, Kawano Y, Ga R, Endo K, Ueda J, Shimizu T, Yoshida H. Vasopressin and fluid retention after liver resection: Comparison with the renin-angiotensin-aldosterone system by surgical extent and liver function. World J Gastroenterol 2026; 32(10): 115167
- URL: https://www.wjgnet.com/1007-9327/full/v32/i10/115167.htm
- DOI: https://dx.doi.org/10.3748/wjg.v32.i10.115167