
















©Author(s) (or their employer(s)) 2026.
World J Gastroenterol. Mar 14, 2026; 32(10): 115130
Published online Mar 14, 2026. doi: 10.3748/wjg.v32.i10.115130
Published online Mar 14, 2026. doi: 10.3748/wjg.v32.i10.115130
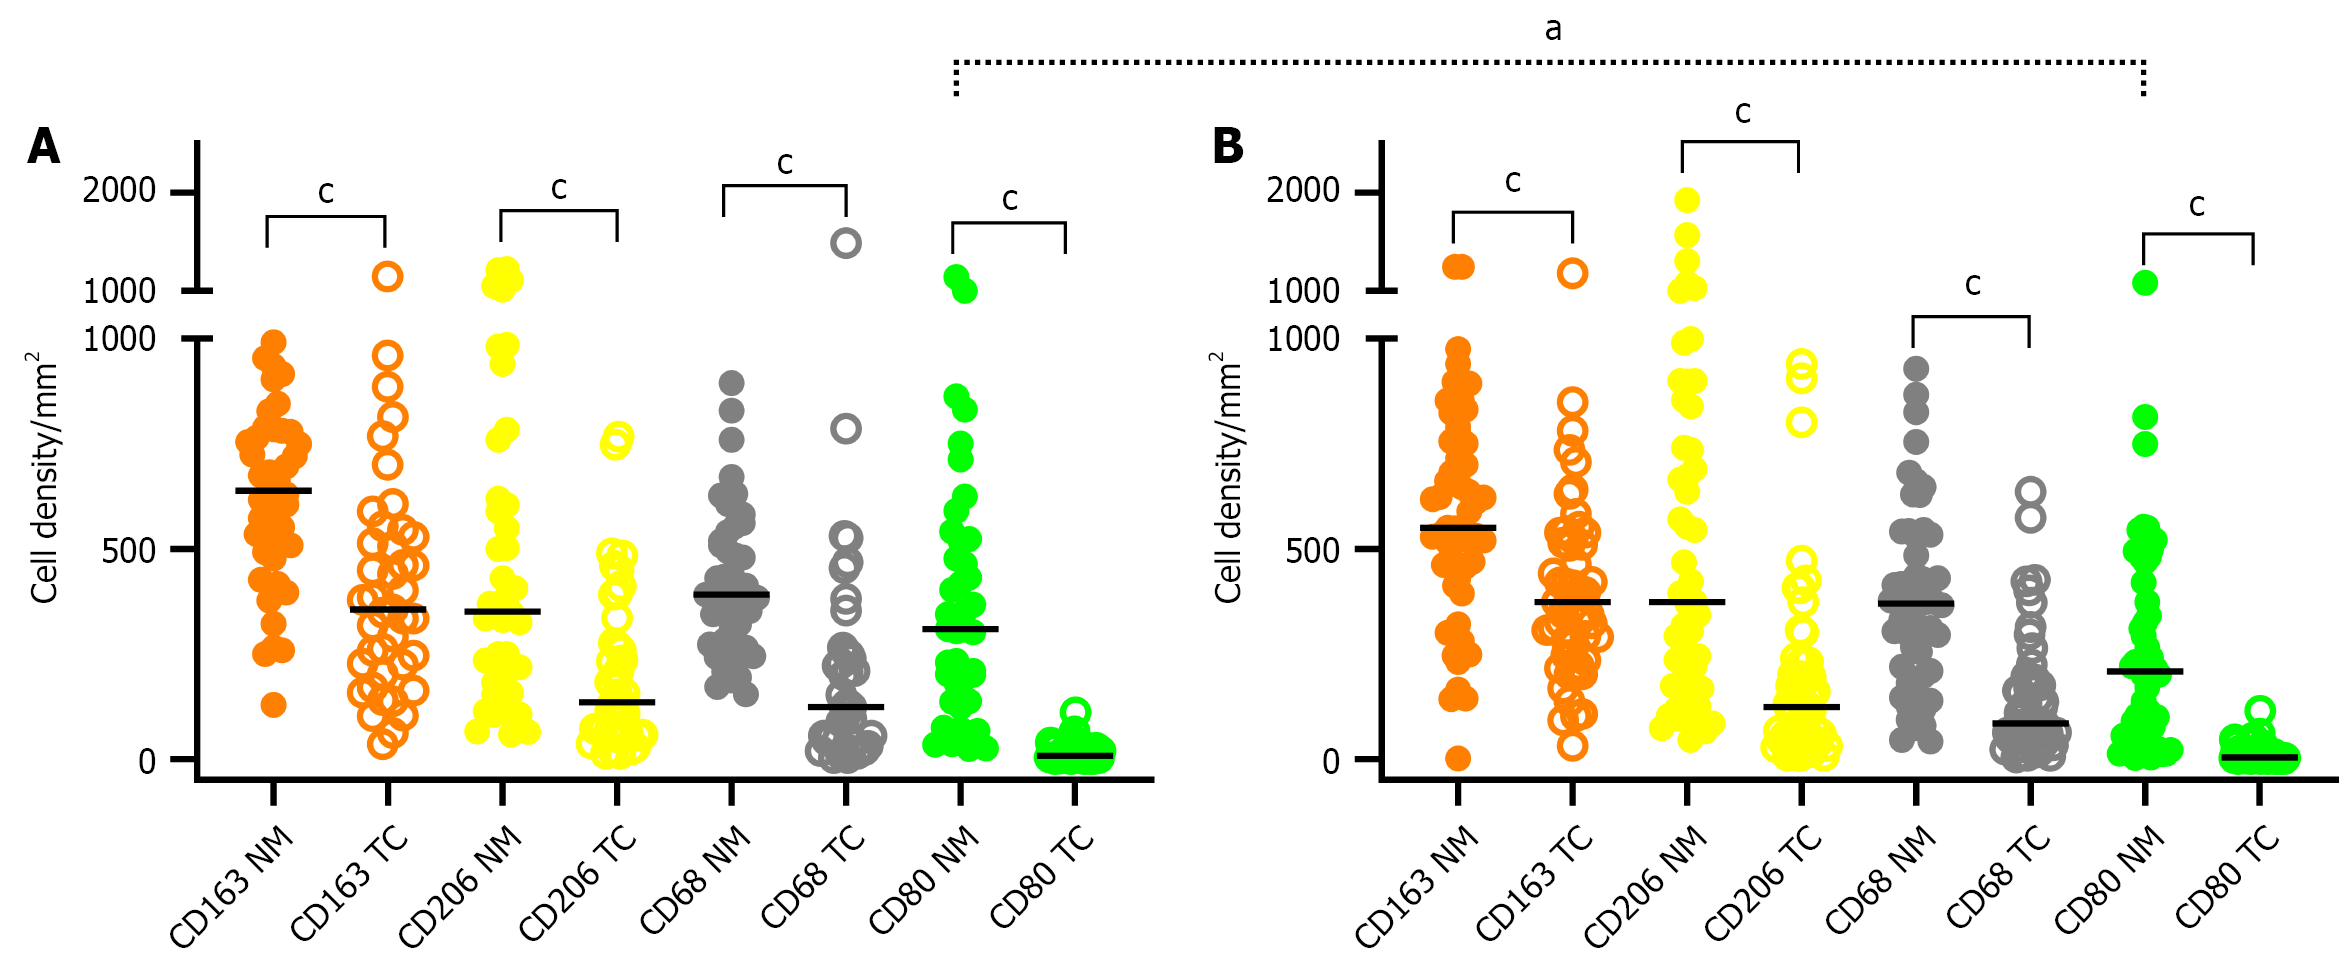
Figure 2 Statistics depicting the spatial distribution of macrophages in adjacent nontumor mucosa and tumor center.
A: Stage I-III; B: Stage IV. Statistics depicting the spatial distribution of CD68+, CD163+, CD206+ and CD80+ tumor infiltrating macrophages per mm2 of the section in the adjacent nontumor mucosa and tumor center of primary colorectal cancer in patients of stage I-III and IV. Black lines: Medians. aP < 0.05, cP < 0.001. NM: Adjacent nontumor mucosa; TC: Tumor center.
- Citation: Ye WJ, Ali E, Pavlov S, Červenková L, Ambrozkiewicz F, Vyčítal O, Hošek P, Zitrický F, Daum O, Liška V, Hemminki K, Trailin A. Distribution and prognostic value of macrophages in colorectal cancer and adjacent mucosa in patient stages I-III vs IV. World J Gastroenterol 2026; 32(10): 115130
- URL: https://www.wjgnet.com/1007-9327/full/v32/i10/115130.htm
- DOI: https://dx.doi.org/10.3748/wjg.v32.i10.115130